| FileName | Description |
|---|---|
| ANOVA | ANOVA MODEL (all genes and samples, least squares), log2 fold change for all groups, genes with F-statistics > 90th percentile |
| miR.1vsControl.ls | ANOVA MODEL (all genes and samples, least squares), miR.1vsControl contrast: miR.1 vs. miR.control, genes with -statistics > 90th percentile |
| miR.206vsControl.ls | ANOVA MODEL (all genes and samples, least squares), miR.206vsControl contrast: miR.206 vs. miR.control, genes with -statistics > 90th percentile |
| miR.27bvsControl.ls | ANOVA MODEL (all genes and samples, robust), miR.27bvsControl contrast: miR.27b vs miR.control, genes with B-statistics > 90th percentile |
| FileName | Description |
|---|---|
| FGFsource.html | A description of the methods and Functional Gene Sets used to perform the Analysis of Functional Annotation |
| absGSE31620.miR.1vsControl.ls | Analysis of Functional Annotation for differentially expressed genes: ABS |
| absGSE31620.miR.206vsControl.ls | Analysis of Functional Annotation for differentially expressed genes: ABS |
| absGSE31620.miR.27bvsControl.ls | Analysis of Functional Annotation for differentially expressed genes: ABS |
| downGSE31620.miR.1vsControl.ls | Analysis of Functional Annotation for differentially expressed genes: DOWN |
| downGSE31620.miR.206vsControl.ls | Analysis of Functional Annotation for differentially expressed genes: DOWN |
| downGSE31620.miR.27bvsControl.ls | Analysis of Functional Annotation for differentially expressed genes: DOWN |
| upGSE31620.miR.1vsControl.ls | Analysis of Functional Annotation for differentially expressed genes: UP |
| upGSE31620.miR.206vsControl.ls | Analysis of Functional Annotation for differentially expressed genes: UP |
| upGSE31620.miR.27bvsControl.ls | Analysis of Functional Annotation for differentially expressed genes: UP |
| FileName | Description |
|---|---|
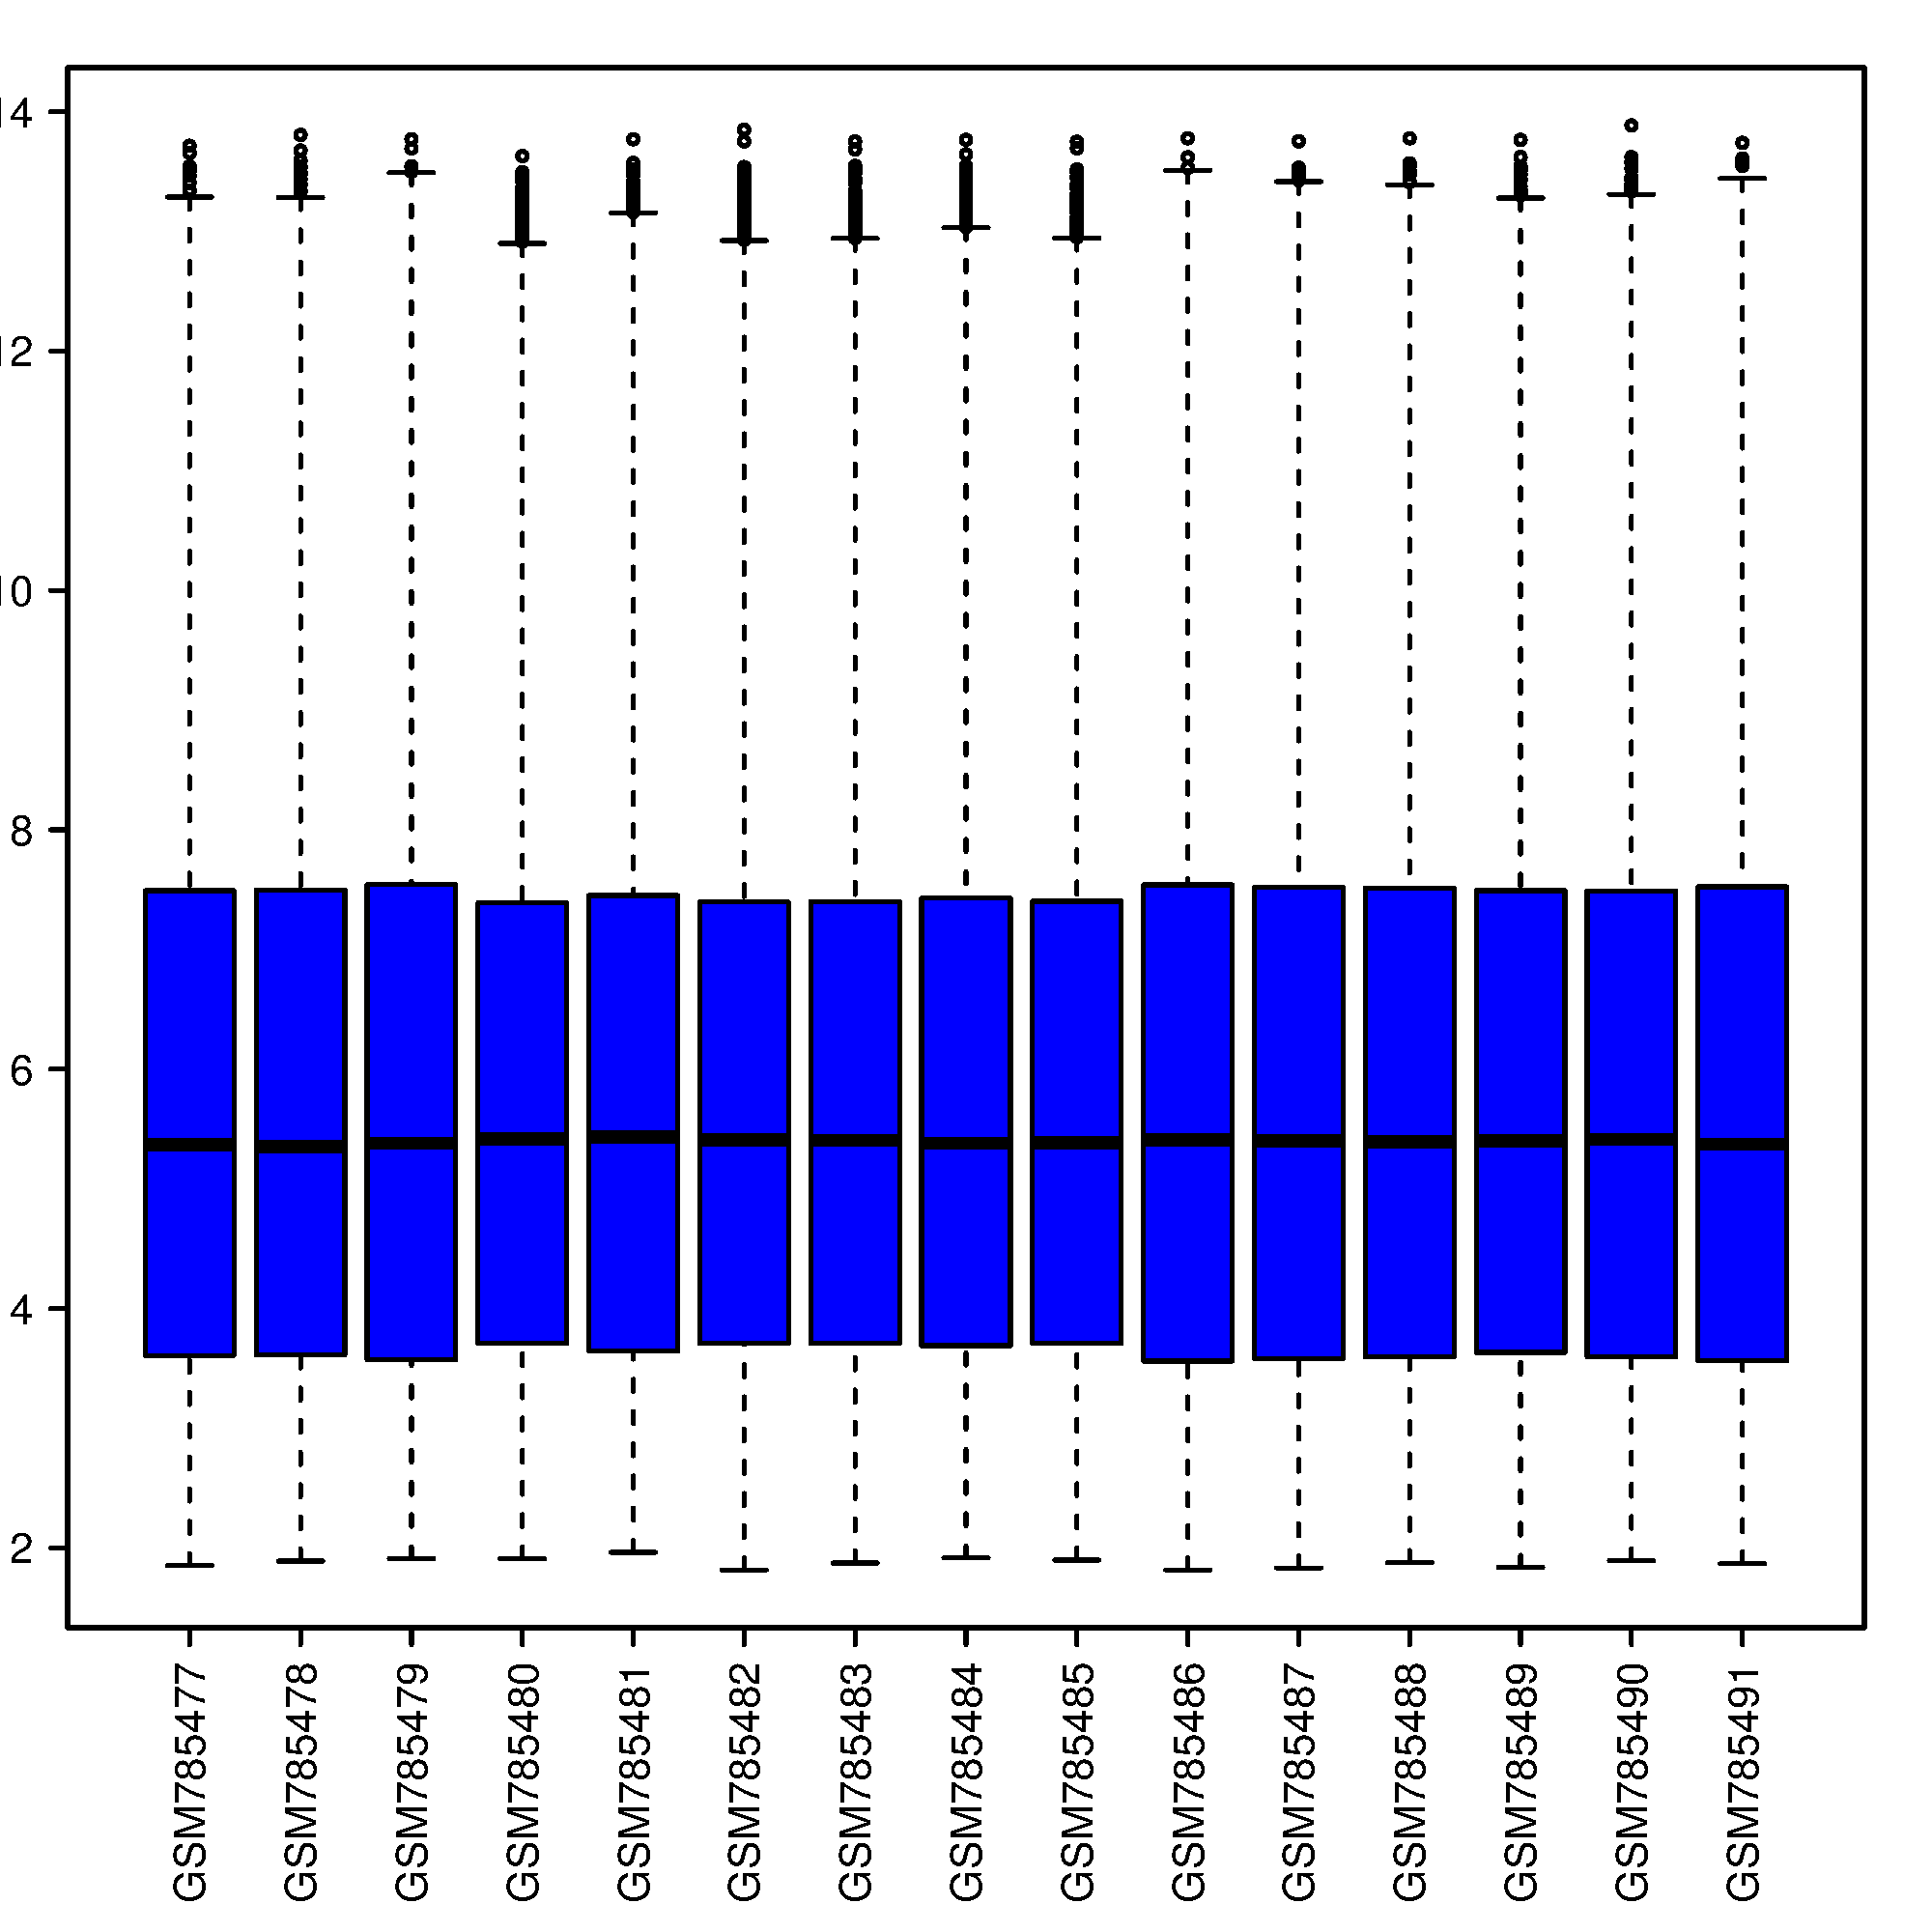
| boxPaffy | Boxplot for Log2 expression after RMA normalization |
| MAplots | MAplots for each array, raw data |
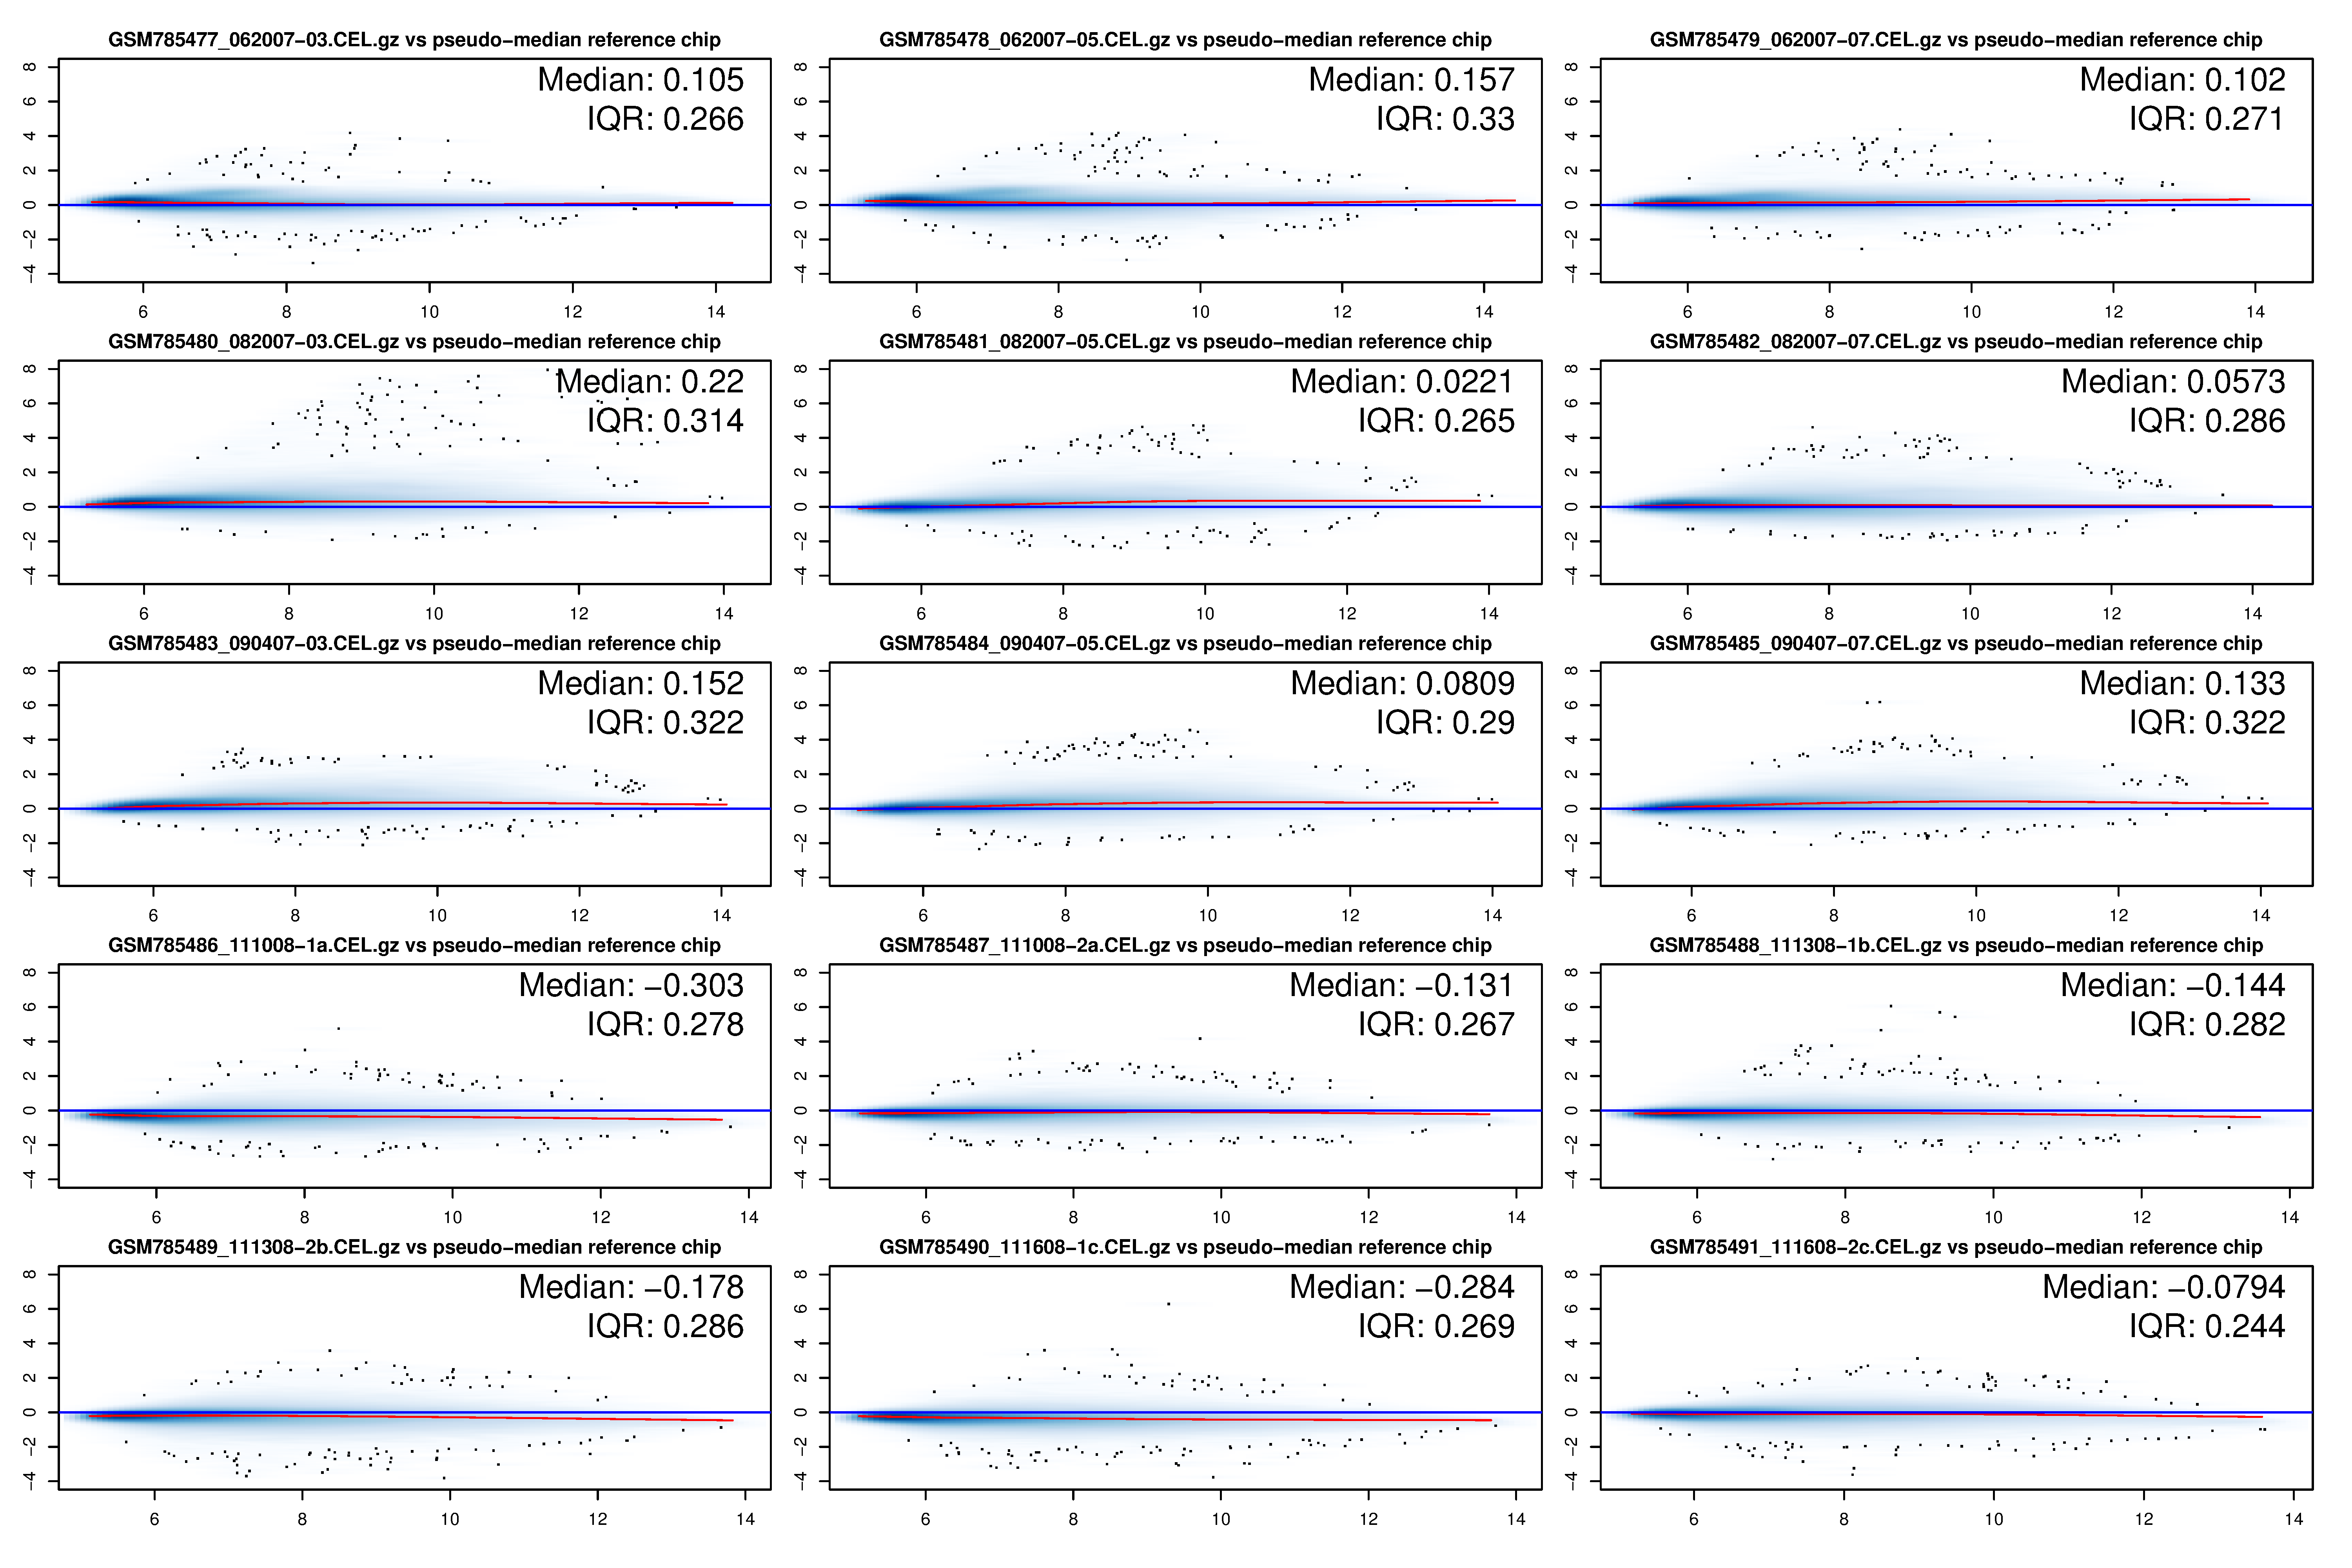
| rmaMAplots | MAplots for each array, after RMA normalization |
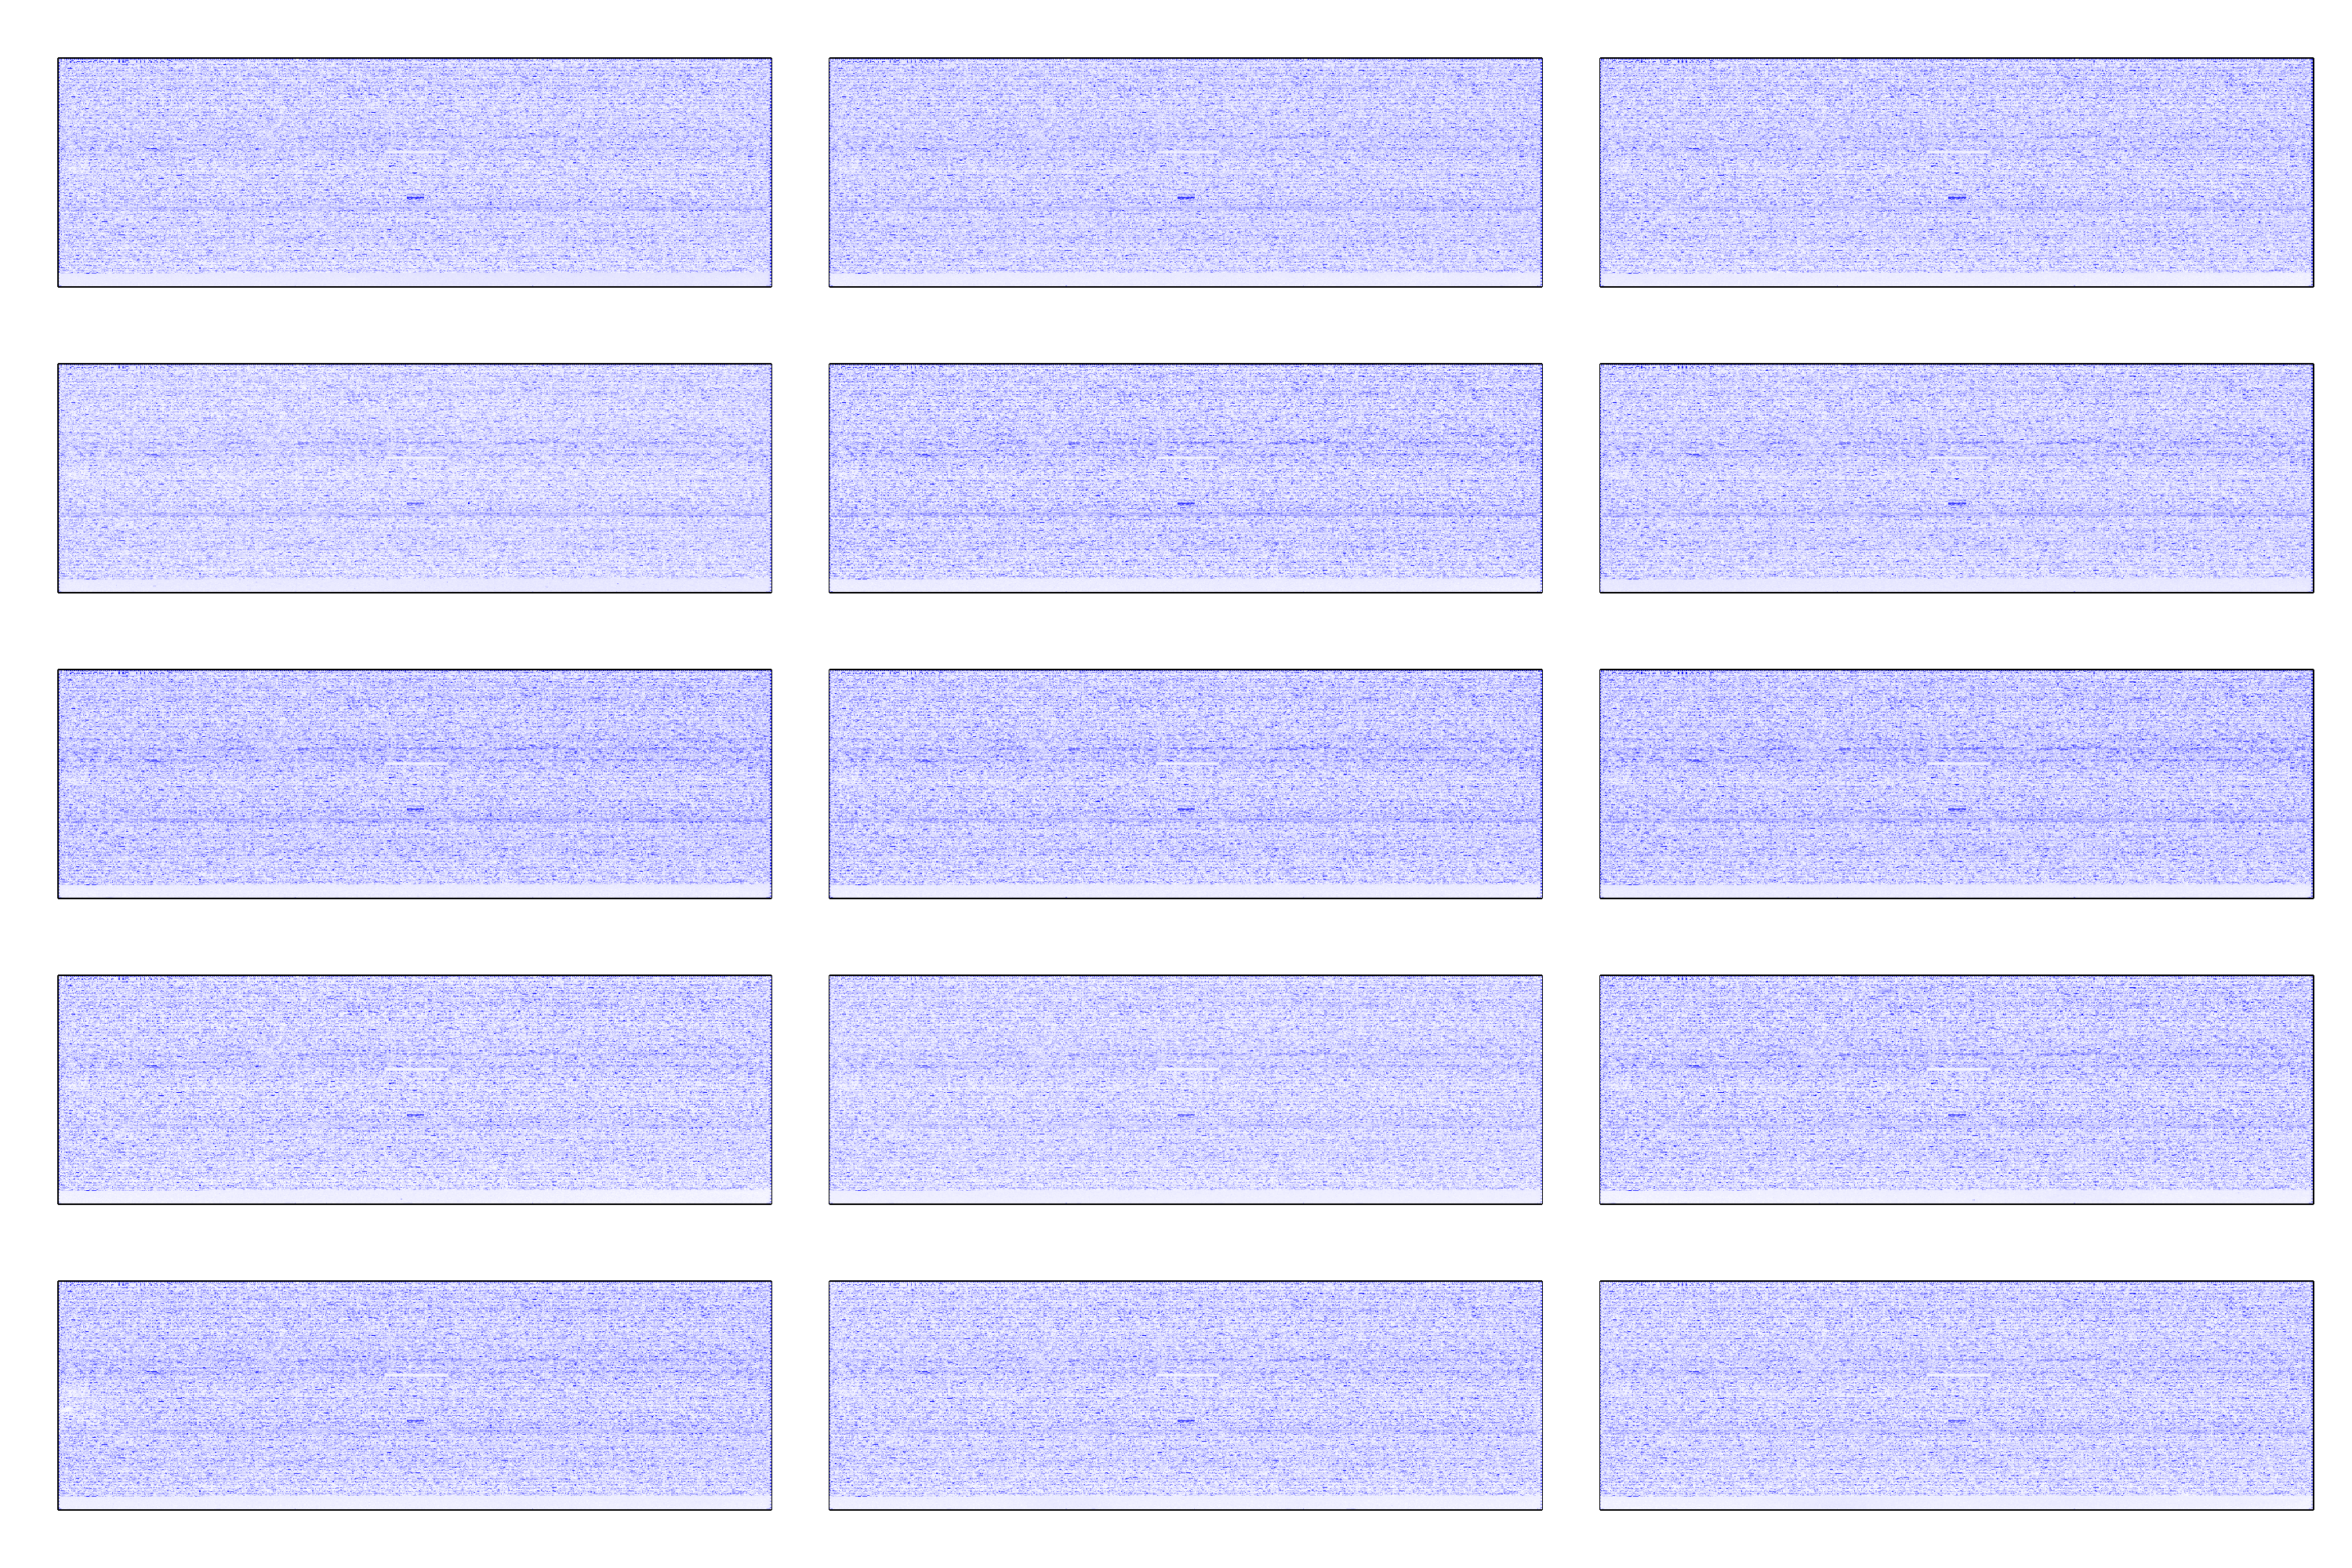
| ima2Daffy | 2D-image plot, after RMA normalization |
| degRNAaffy | RNA degredation plot |
| corrHeatmap | Samples pair-wise correlation heatmap, raw data |
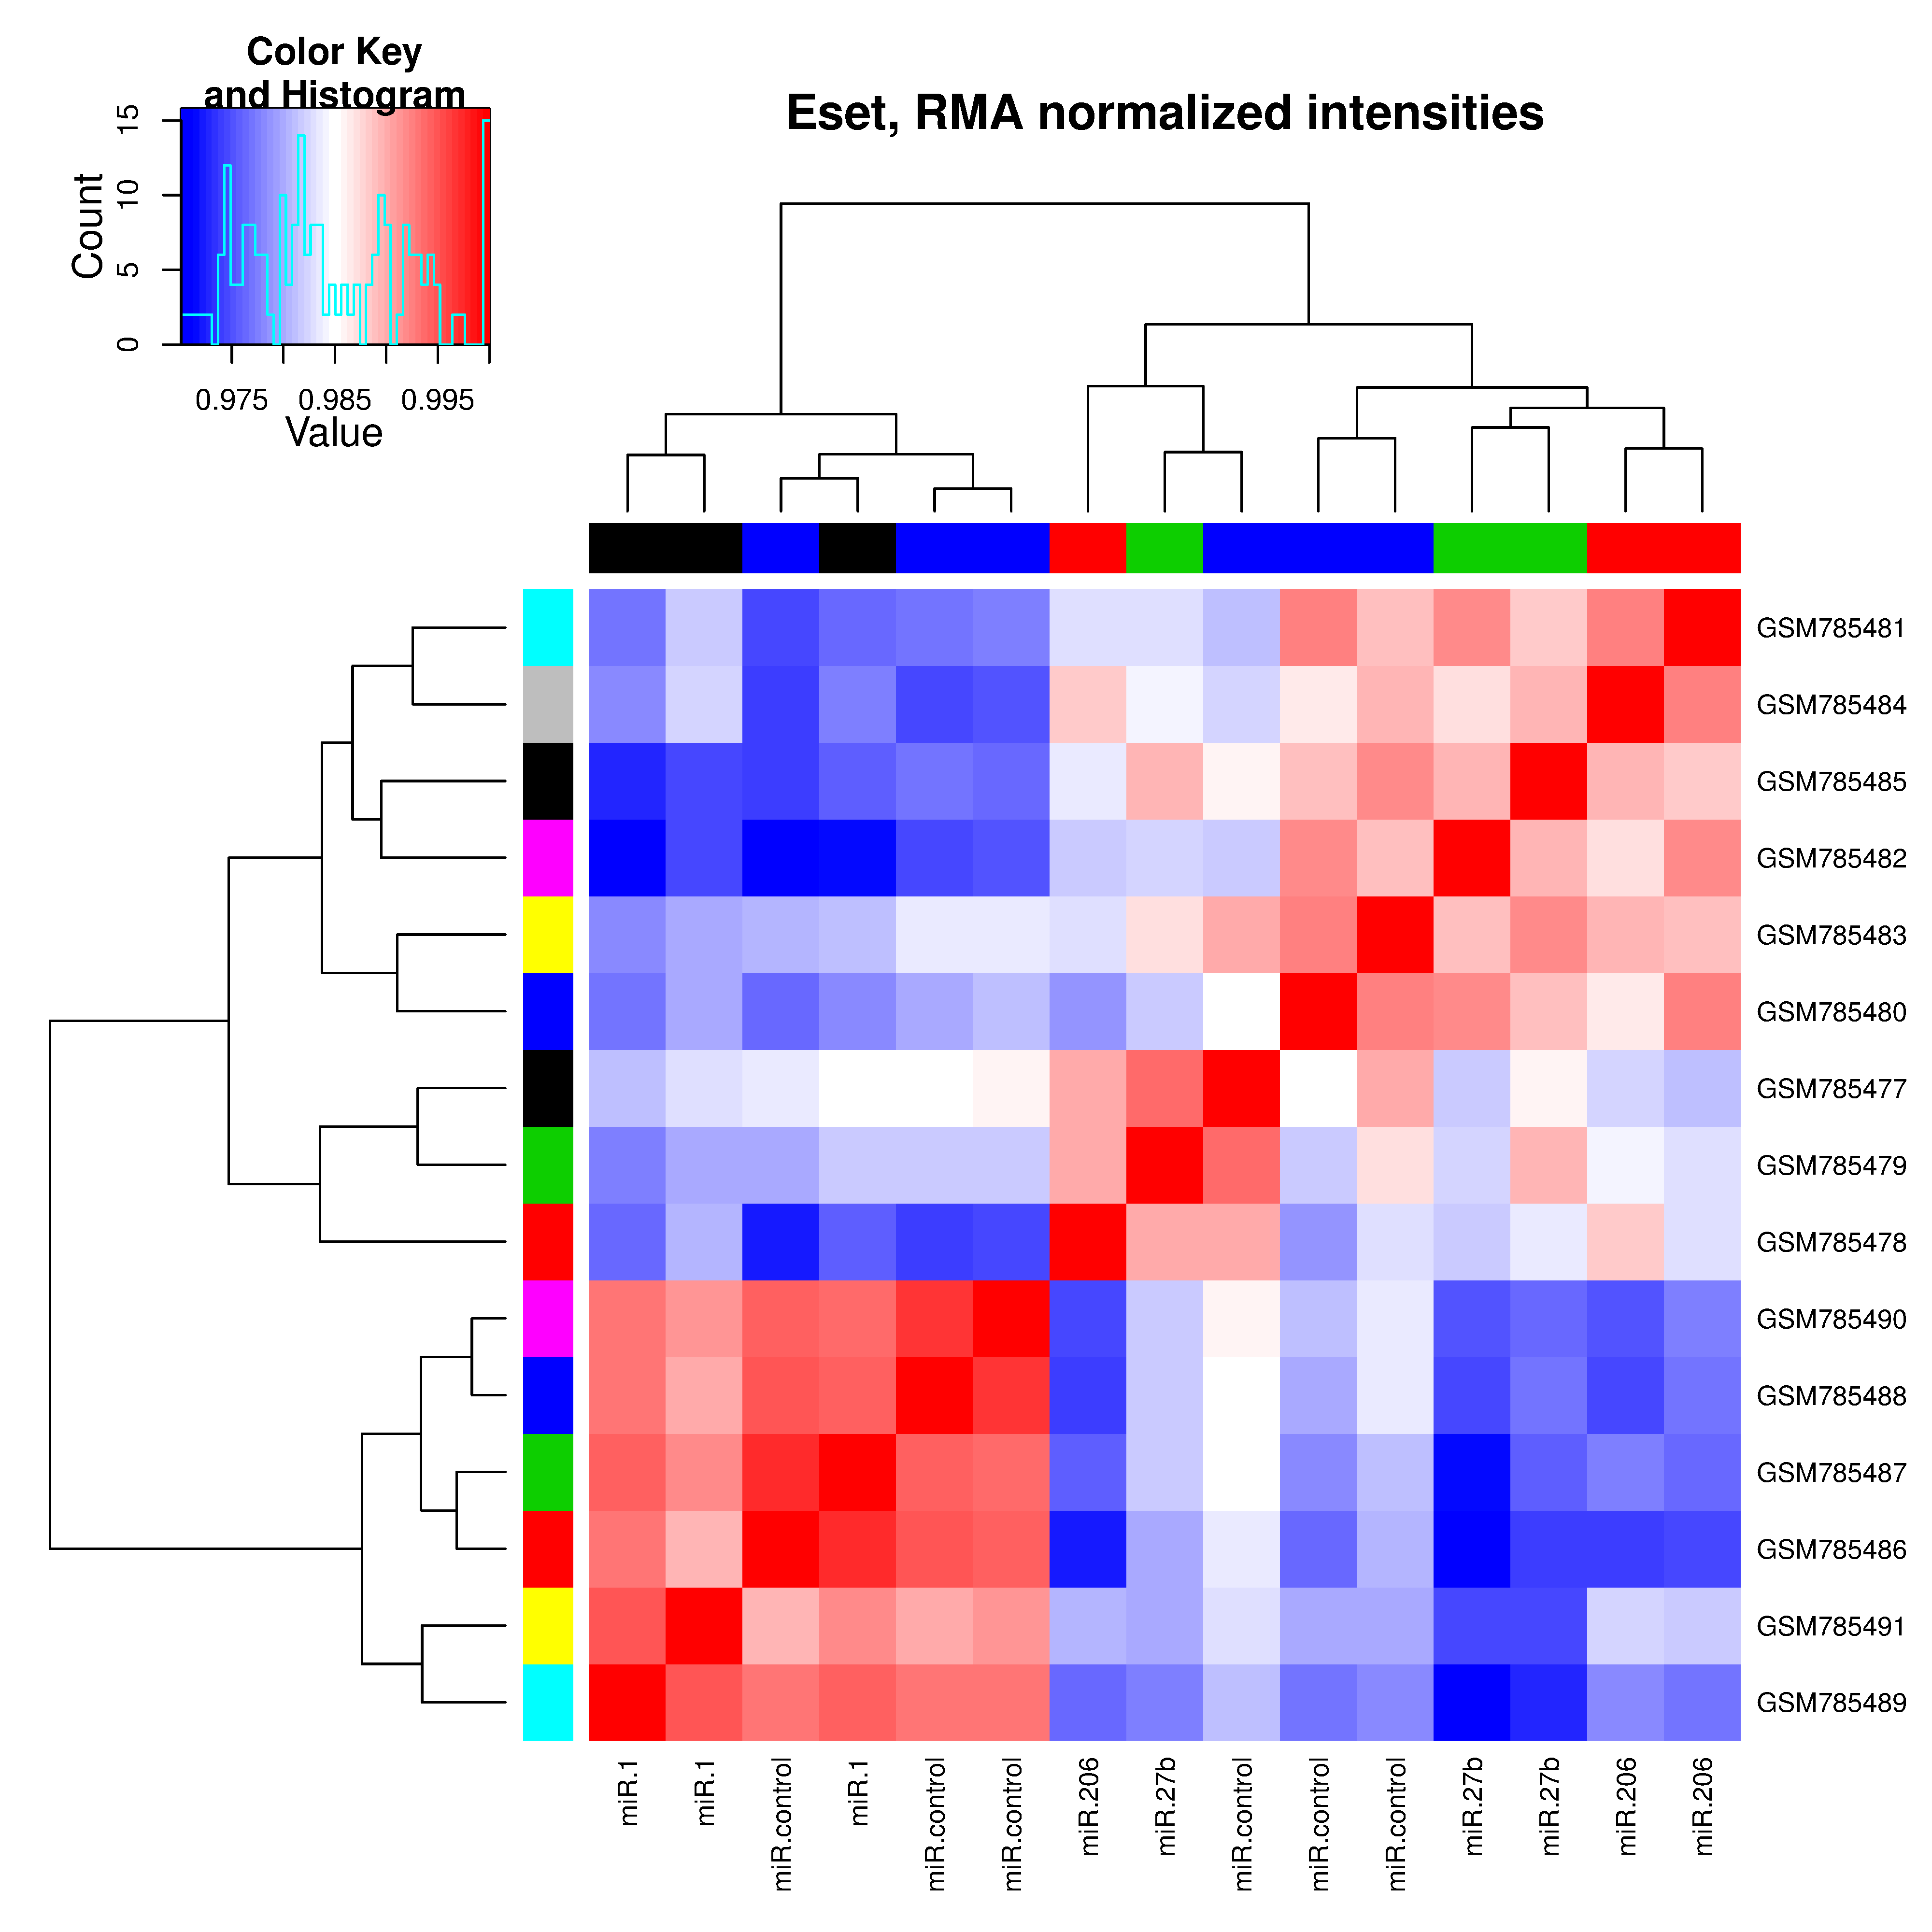
| rmaCorrHeatmap | Samples pair-wise correlation heatmap, RMA normalized data |
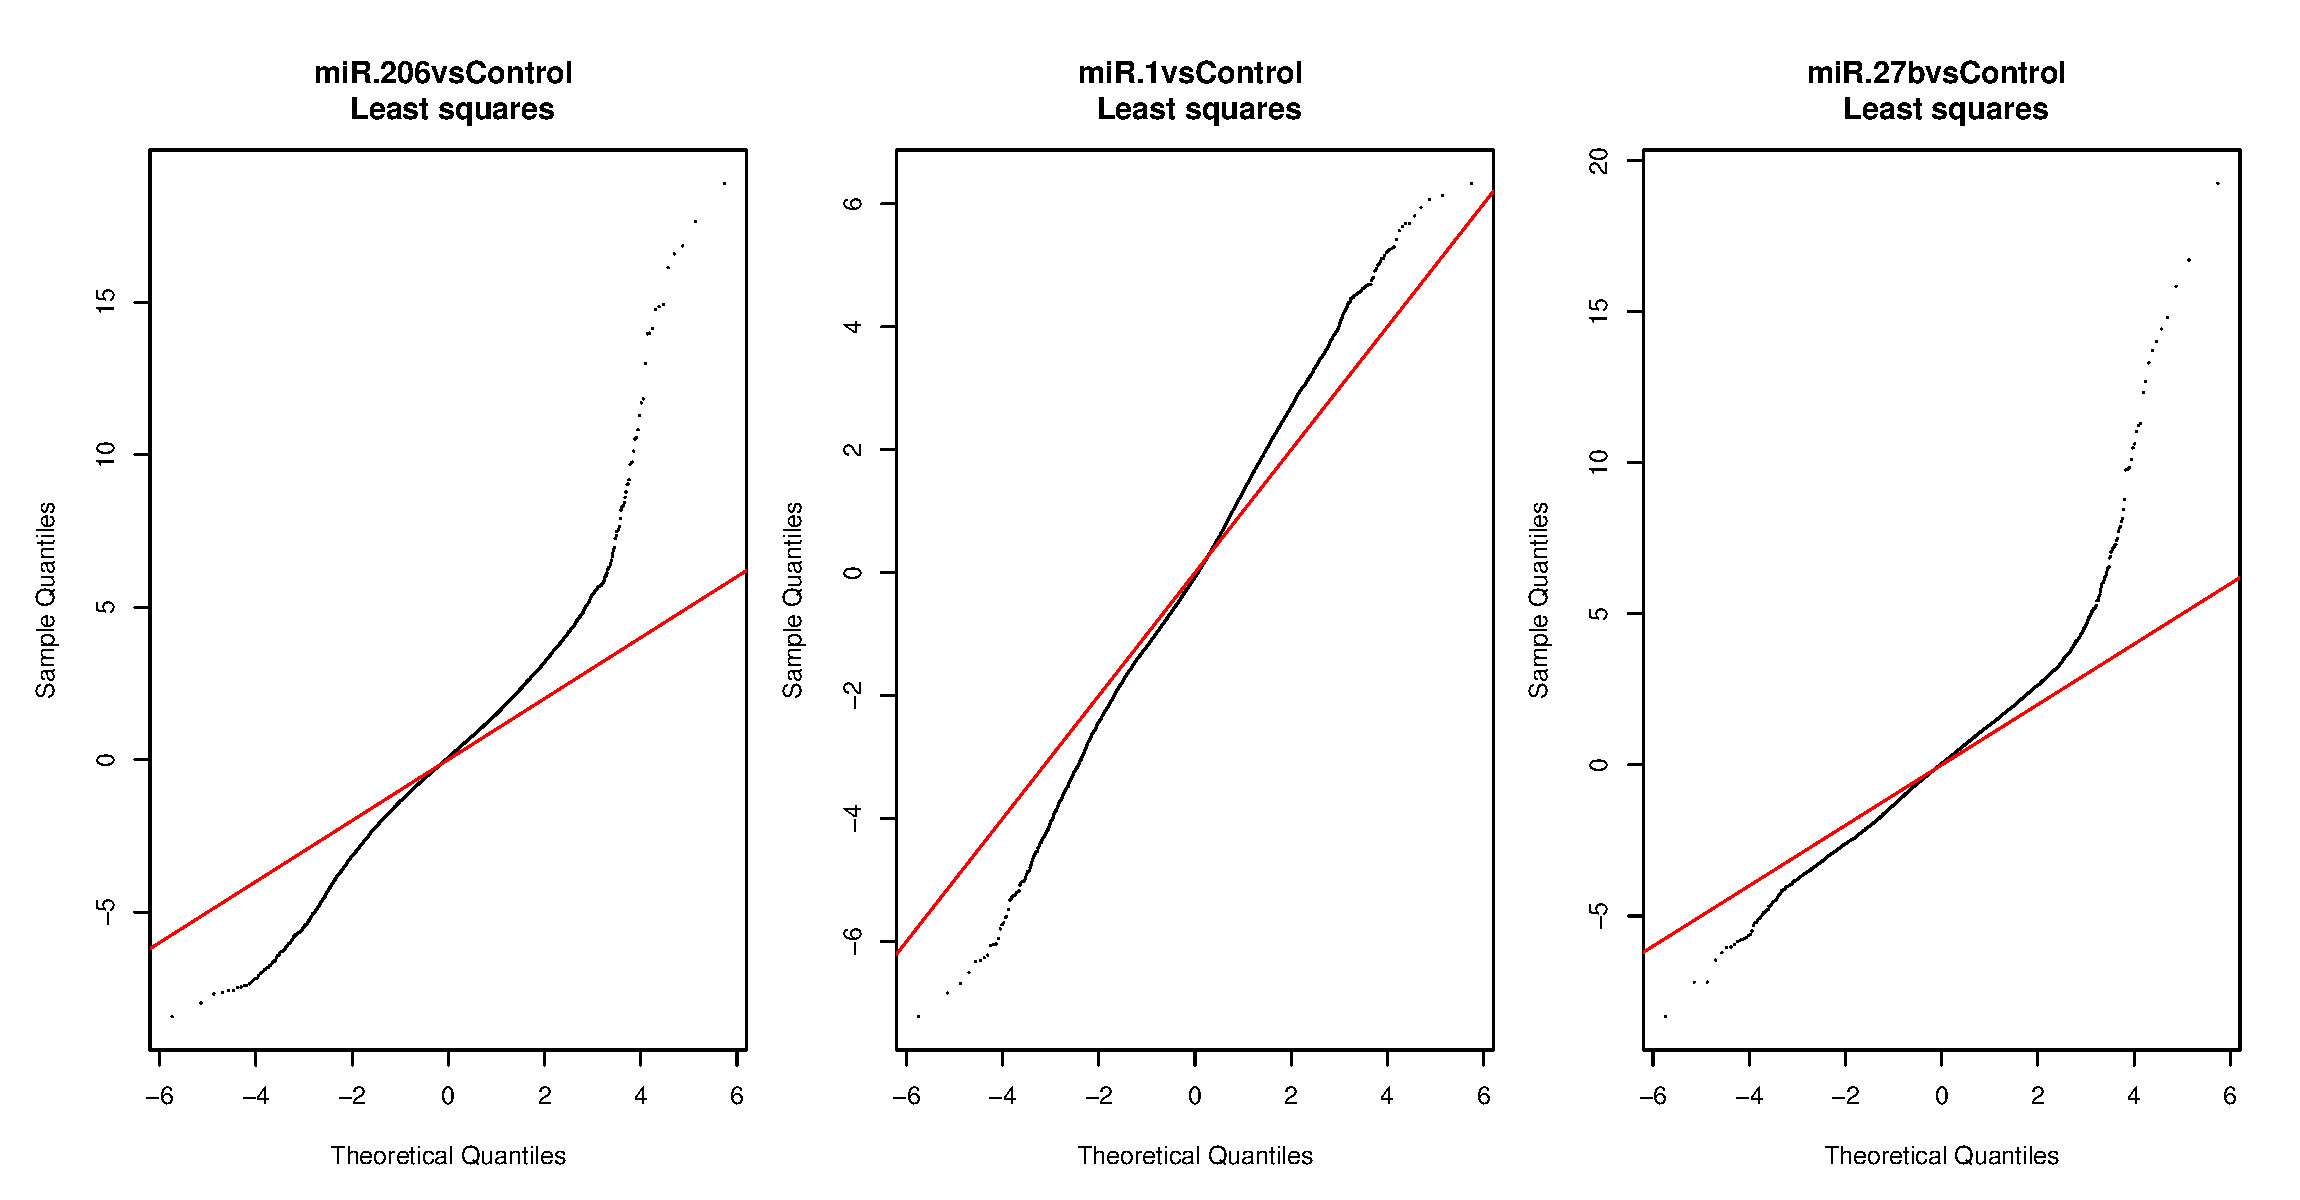
| qqPlots | QQ-plot for each contrast |
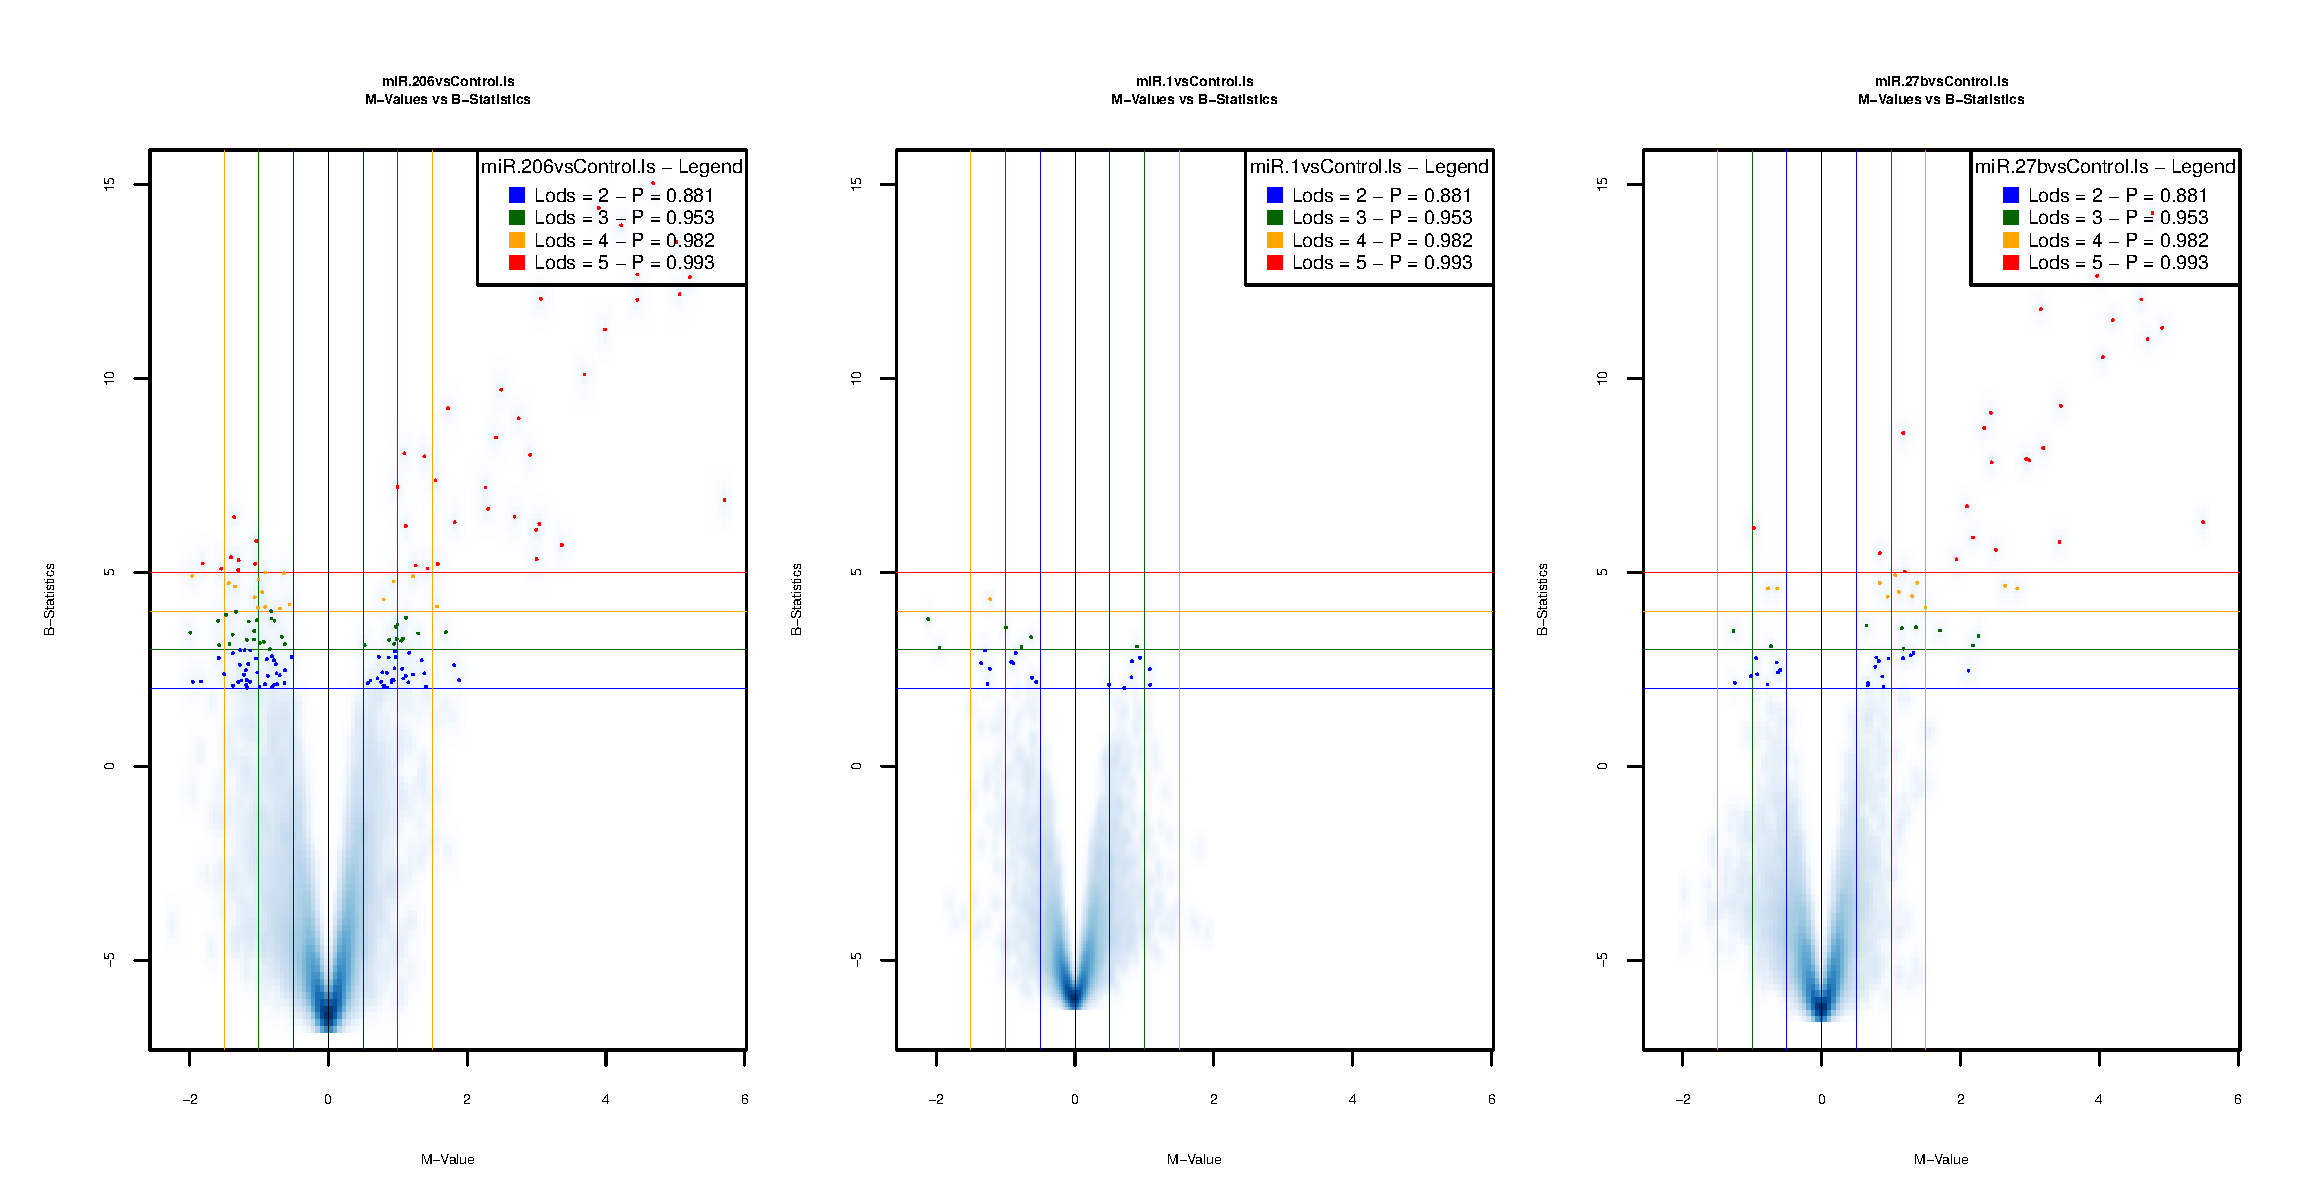
| contrasts.BvsM | Volcano plots for each performed comparison |
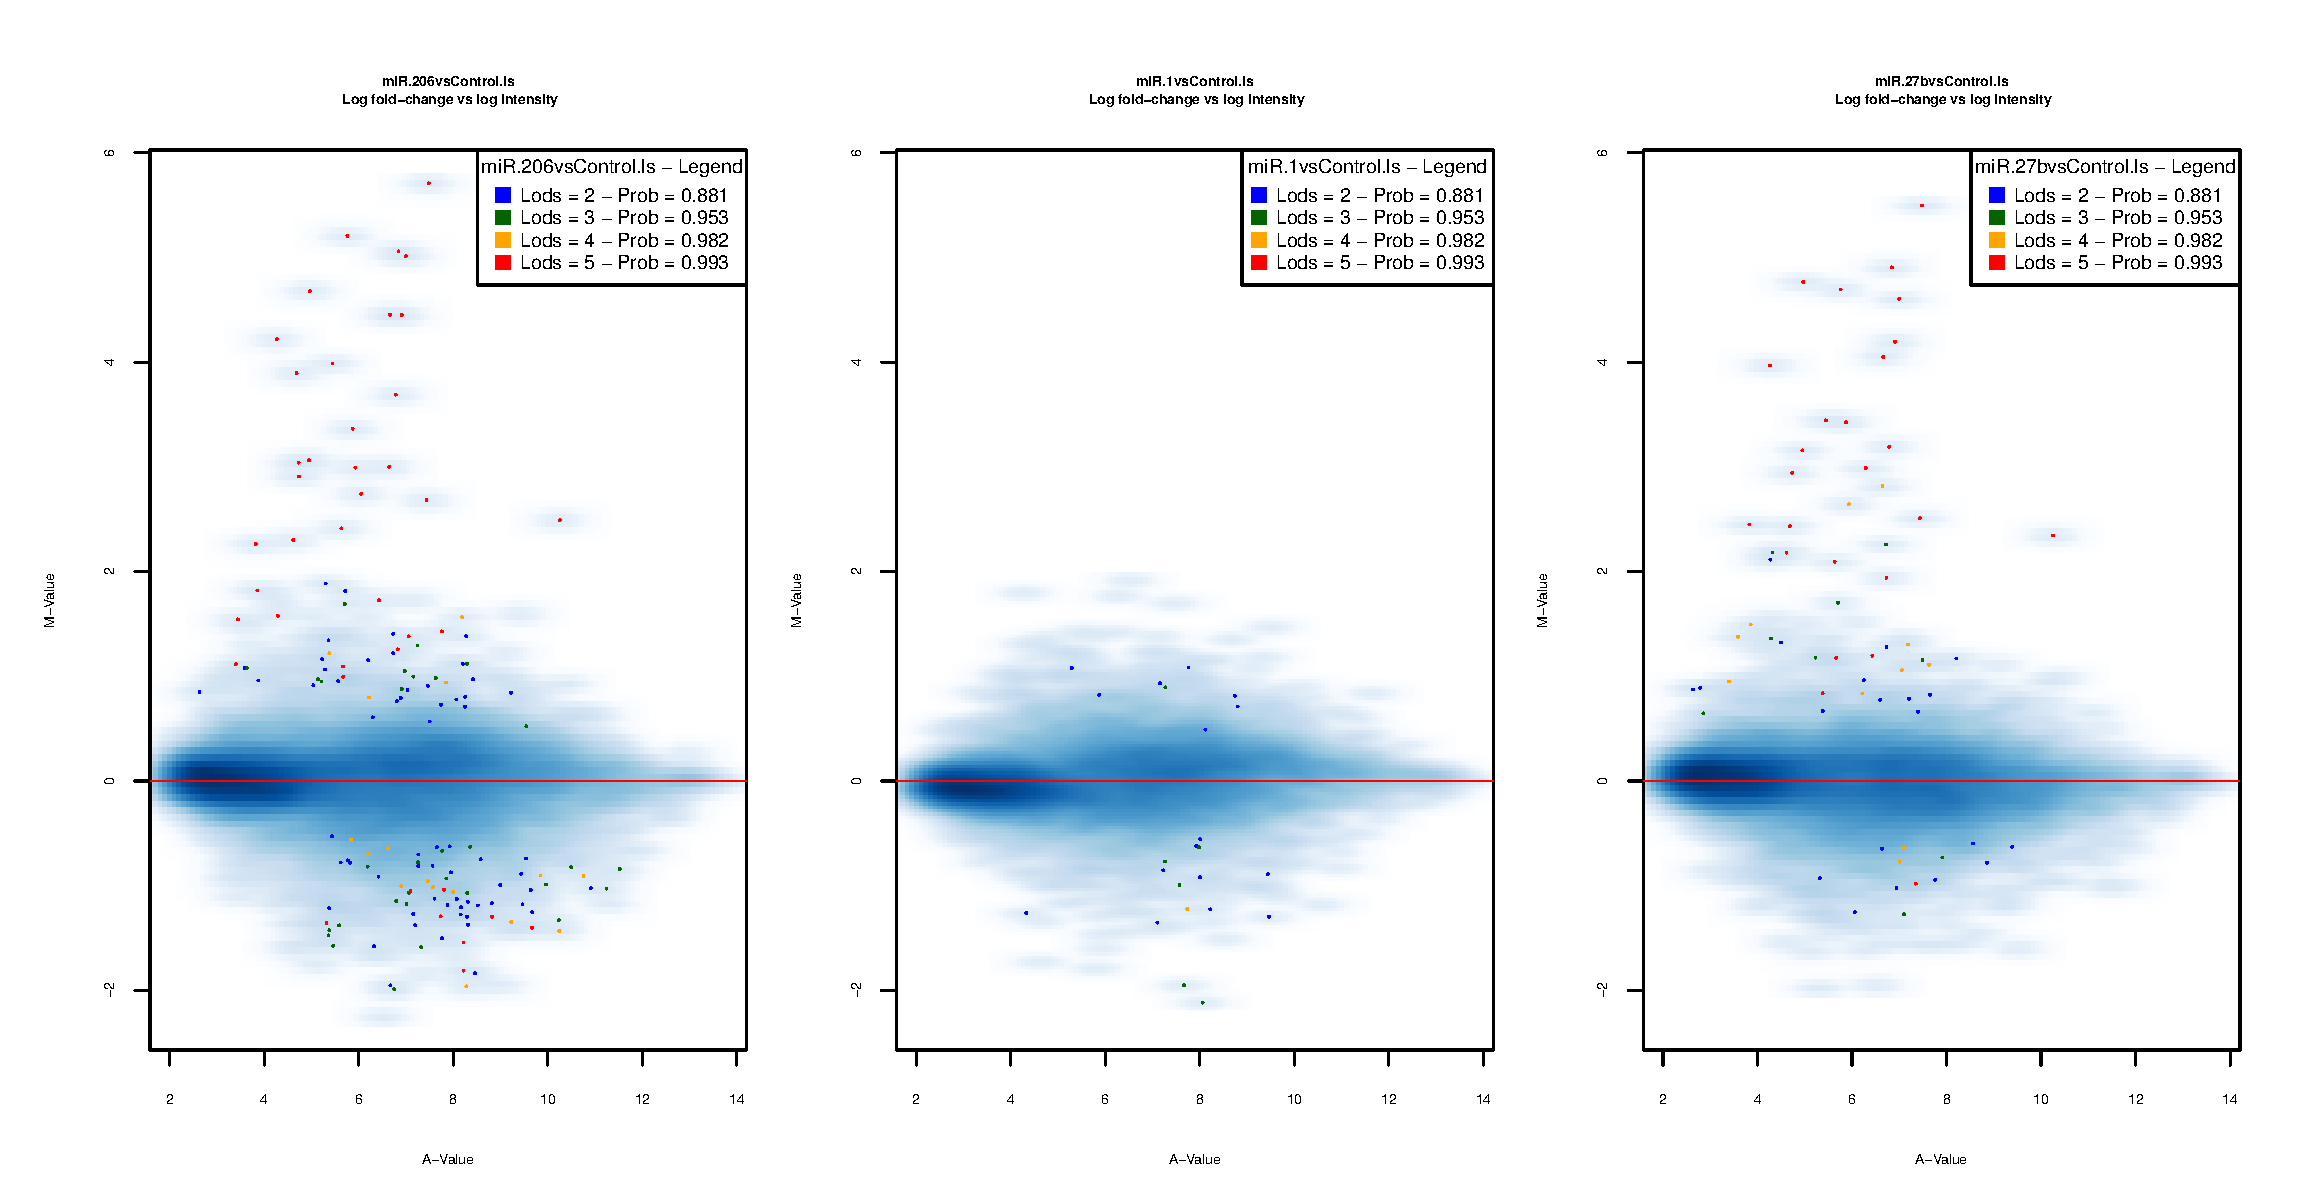
| contrasts.MAplot | MAplots for each performed comparison |