| FileName | Description |
|---|---|
| ANOVA.ls | ANOVA MODEL (all genes and samples, least squares), log2 fold change for all groups, genes with F-statistics > 95th percentile |
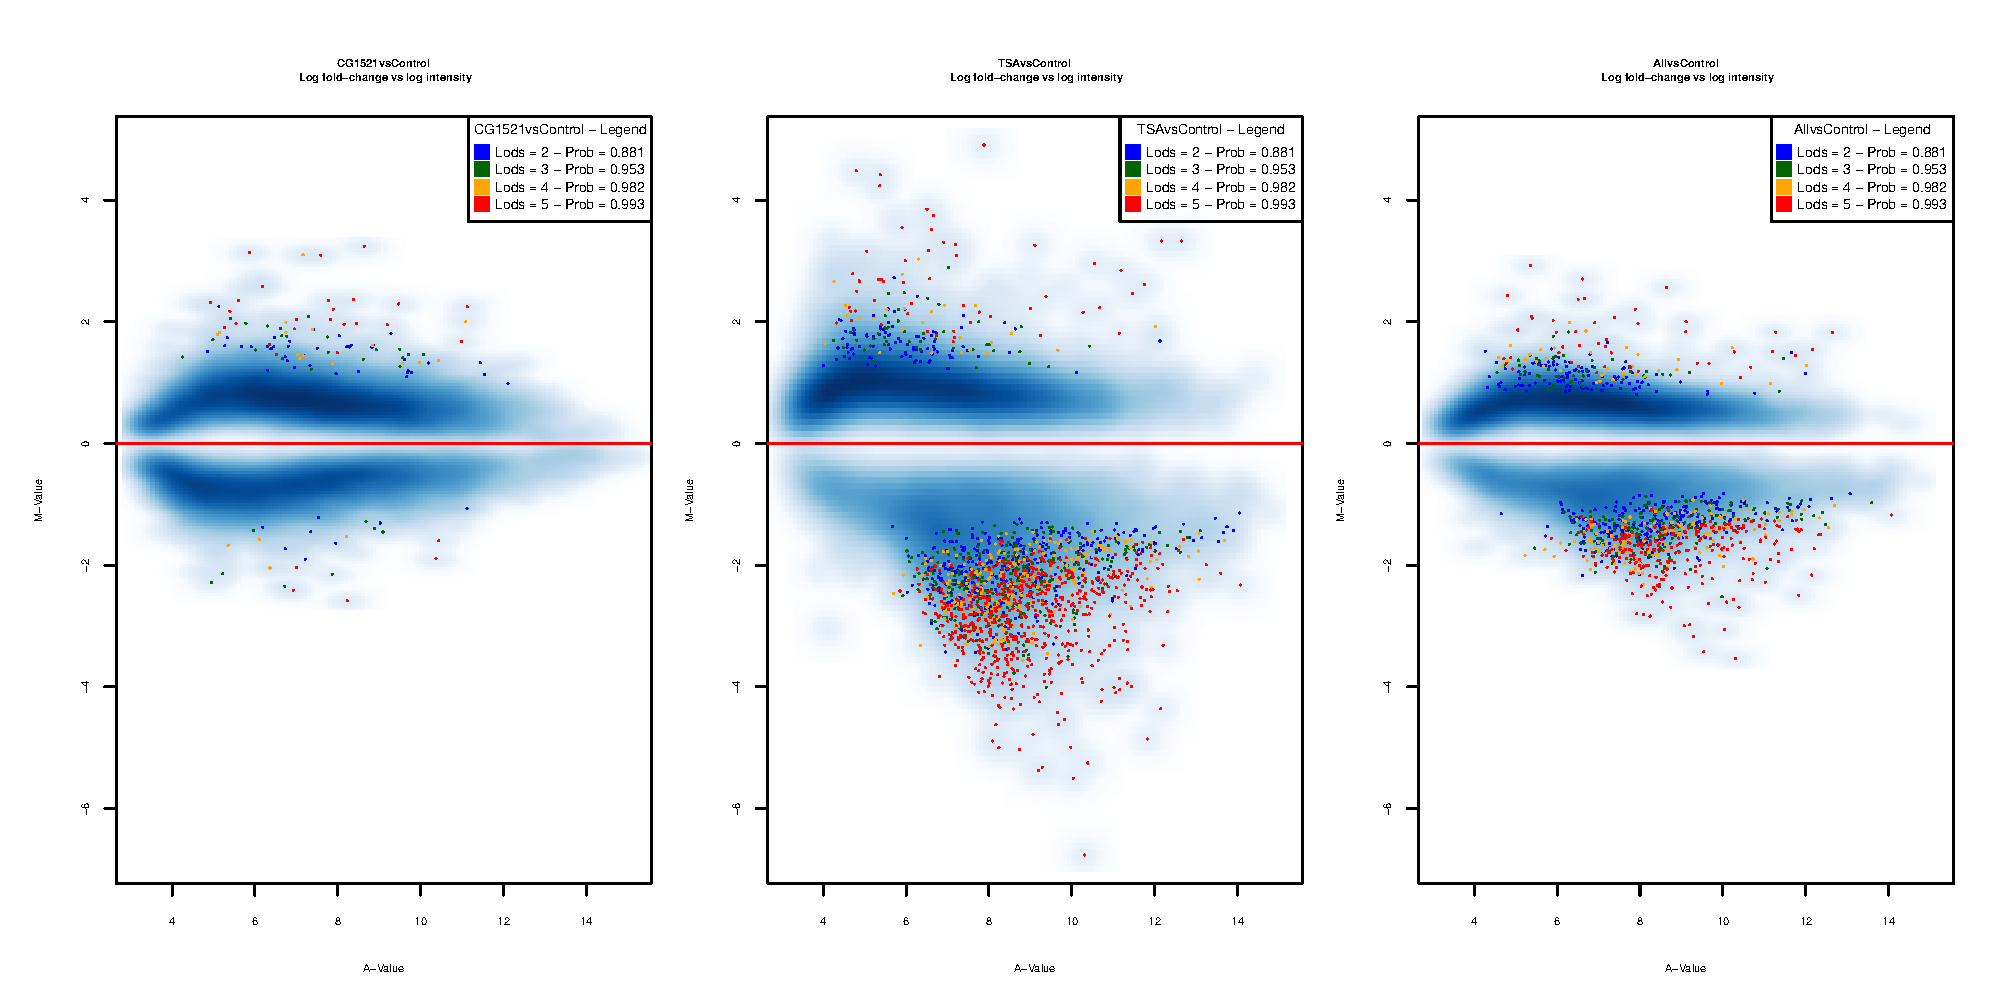
| CG1521vsControl | ANOVA MODEL (all genes and samples, least squares), CG1521vsControl contrast: CG1521 vs Control, genes with B-statistics > 95th percentile |
| TSAvsControl | ANOVA MODEL (all genes and samples, least squares), TSAvsControl contrast: TSA vs Control, genes with B-statistics > 95th percentile |
| AllvsControl | ANOVA MODEL (all genes and samples, least squares), AllvsControl contrast: CG1521+TSA vs Control, genes with B-statistics > 95th percentile |
| FileName | Description |
|---|---|
| FGFsource.html | A description of the methods and Functional Gene Sets used to perform the Analysis of Functional Annotation |
| absGSE8645.AllvsControl | Analysis of Functional Annotation for differentially expressed genes: ABS |
| absGSE8645.CG1521vsControl | Analysis of Functional Annotation for differentially expressed genes: ABS |
| absGSE8645.TSAvsControl | Analysis of Functional Annotation for differentially expressed genes: ABS |
| downGSE8645.AllvsControl | Analysis of Functional Annotation for down-regulated genes: DOWN |
| downGSE8645.CG1521vsControl | Analysis of Functional Annotation for down-regulated genes: DOWN |
| downGSE8645.TSAvsControl | Analysis of Functional Annotation for down-regulated genes: DOWN |
| upGSE8645.AllvsControl | Analysis of Functional Annotation for up-regulated genes: UP |
| upGSE8645.CG1521vsControl | Analysis of Functional Annotation for up-regulated genes: UP |
| upGSE8645.TSAvsControl | Analysis of Functional Annotation for up-regulated genes: UP |
| FileName | Description |
|---|---|
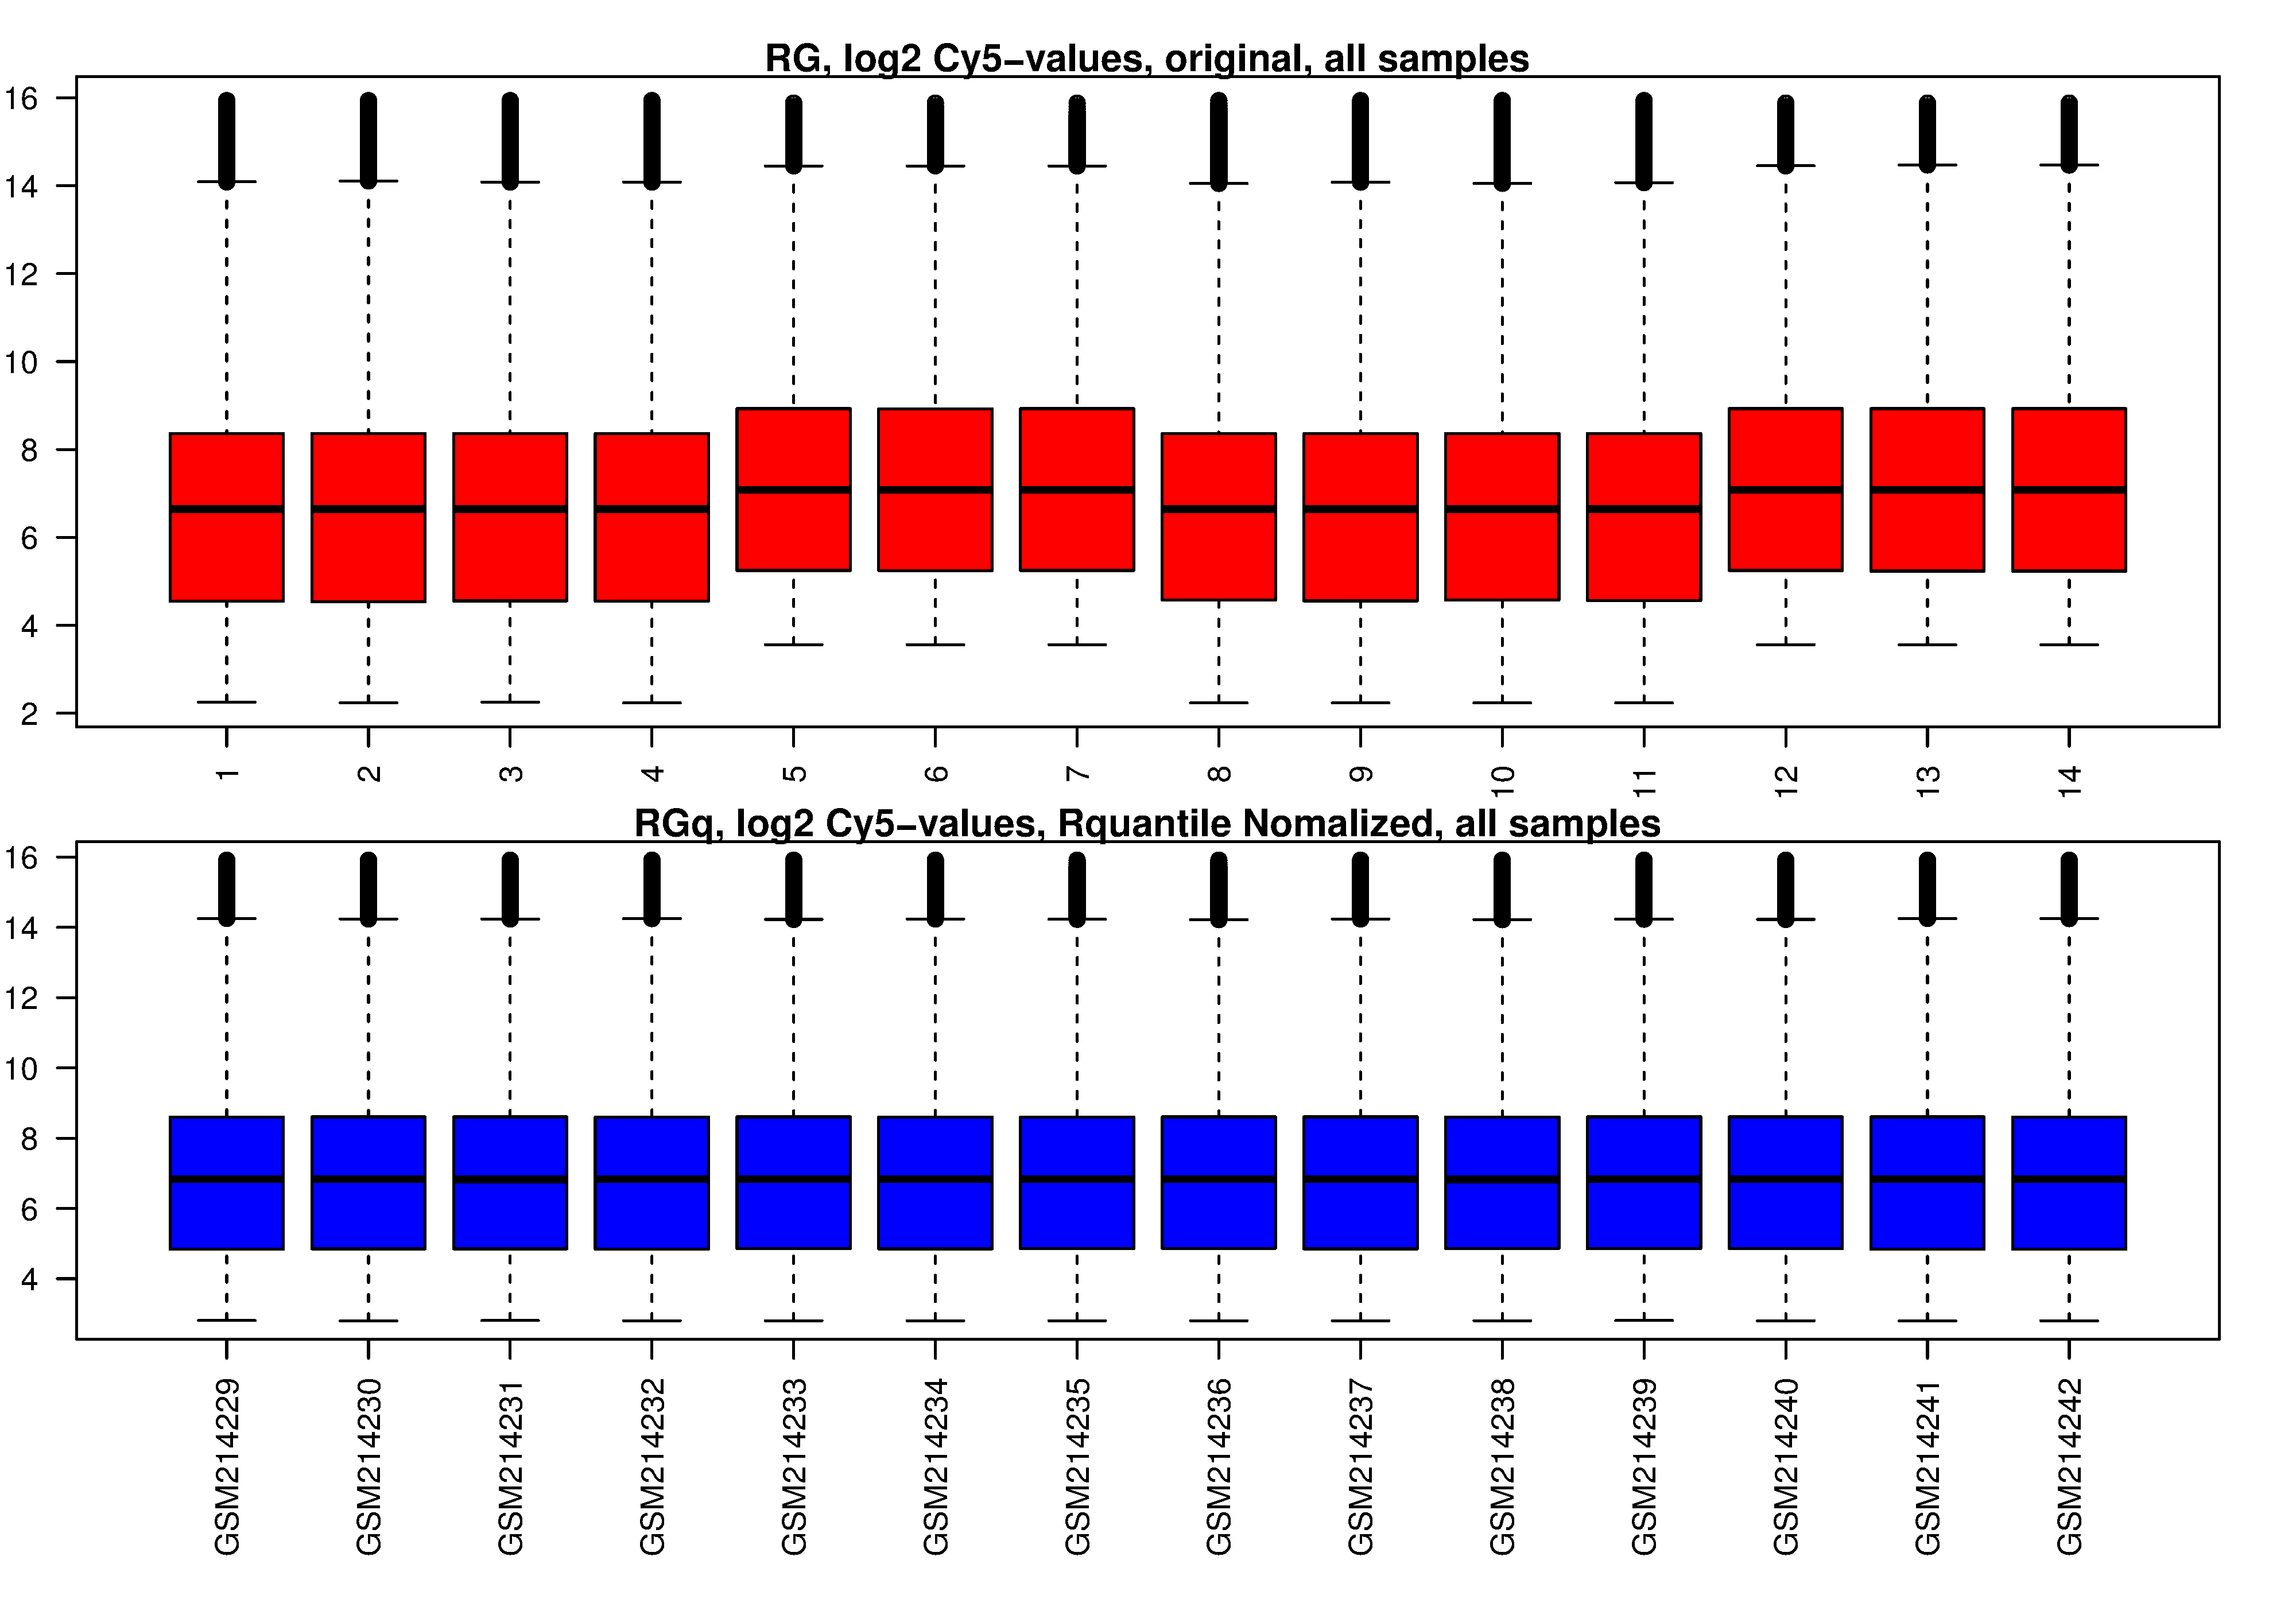
| bxpexp | Boxplot for Log2 expression before and after RMA normalization |
| bxpAval | Boxplot for M values (compared to the median array) before and after RMA normalization |
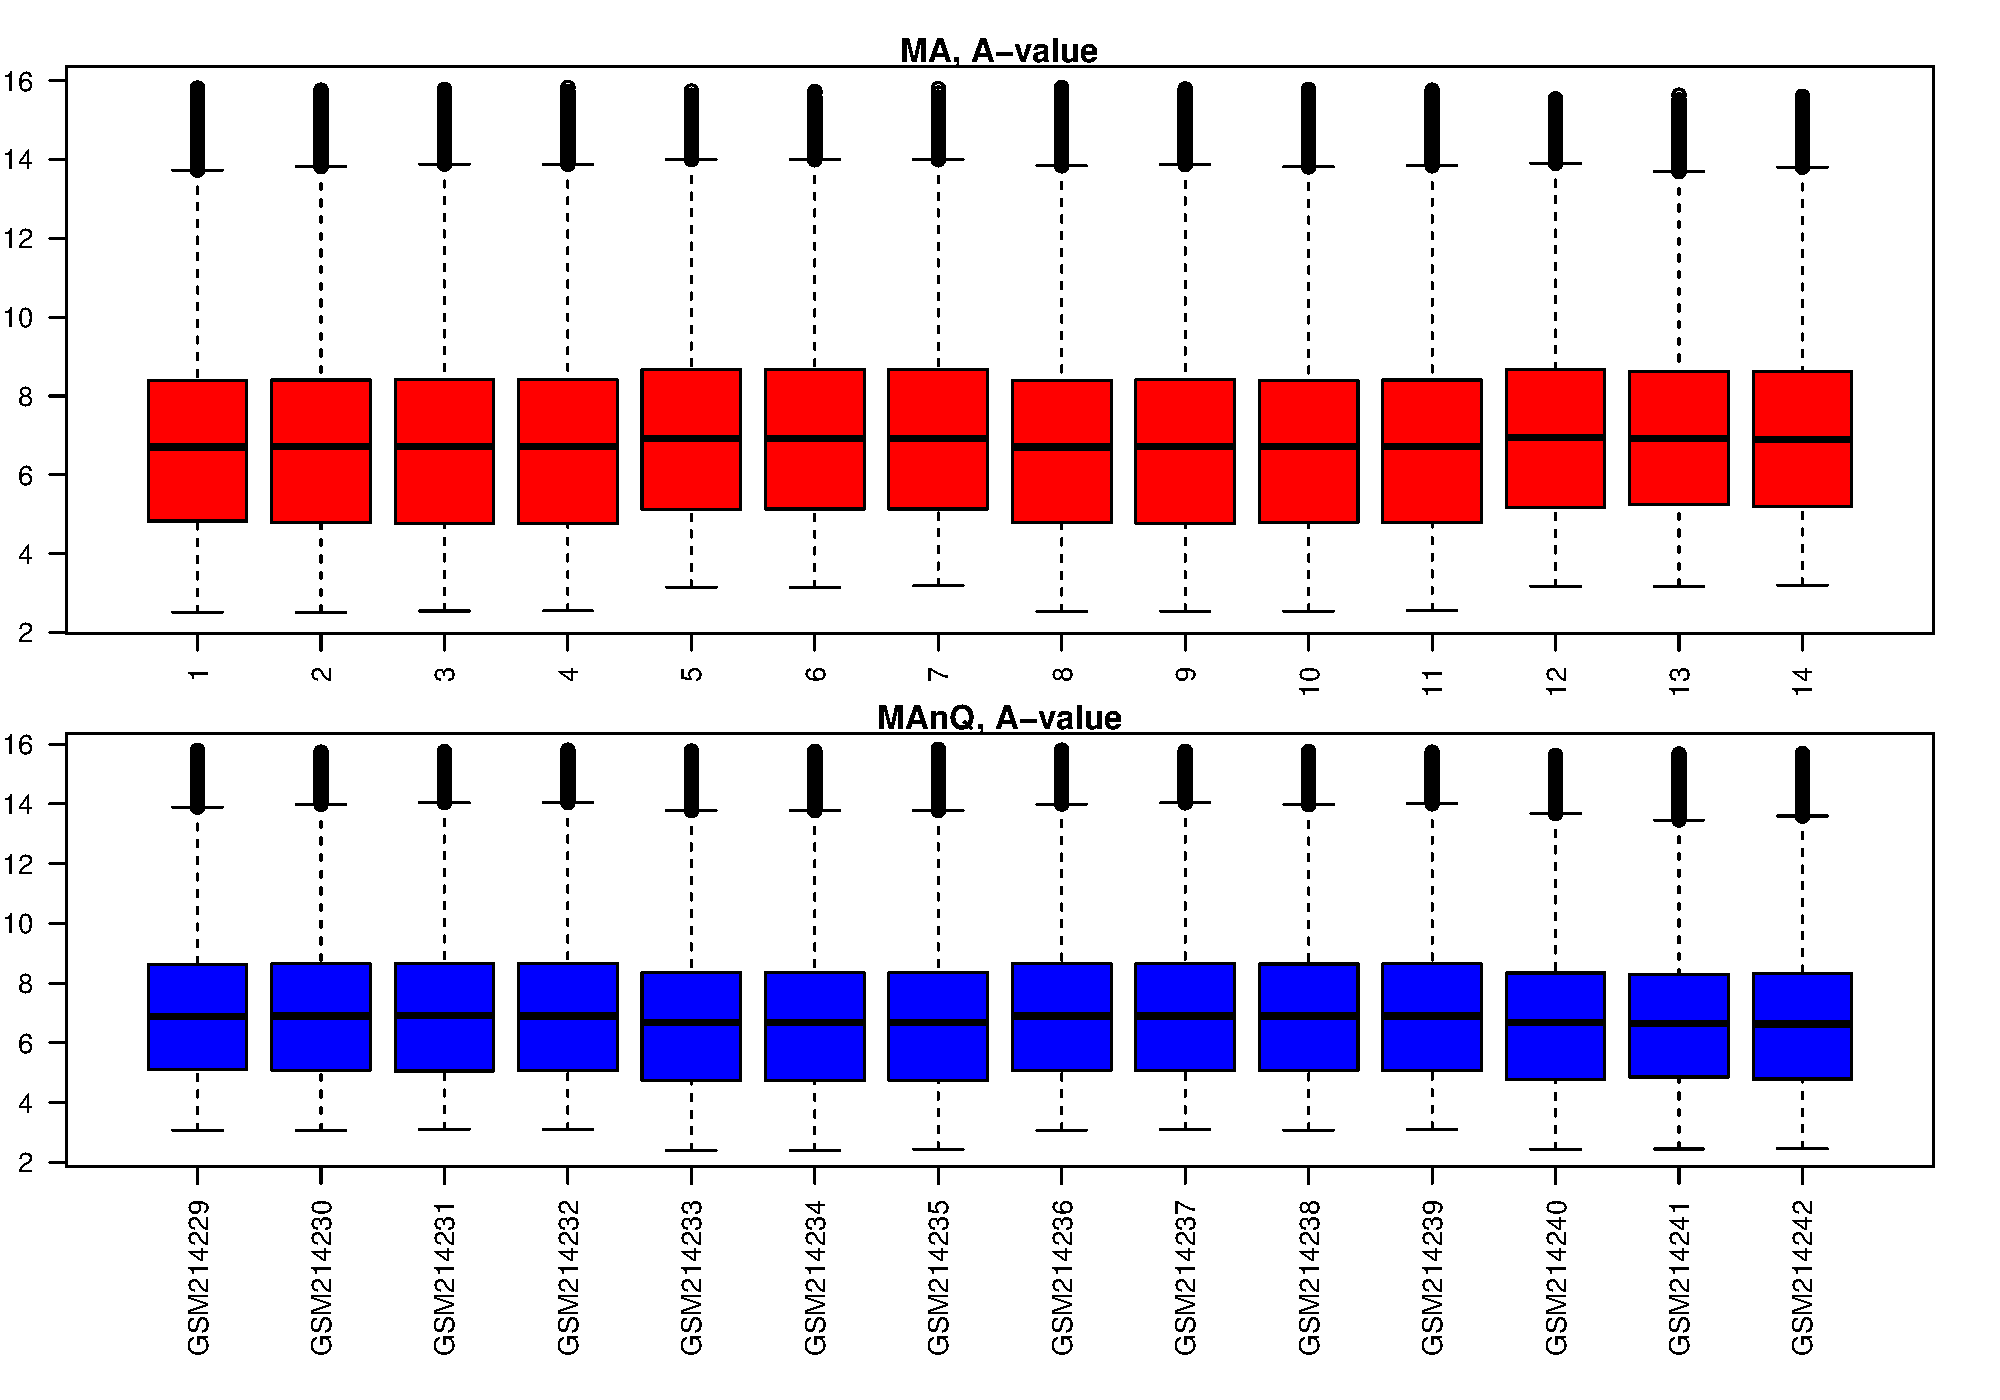
| bxpMval | Boxplot for A values (compared to the median array) before and after RMA normalization |
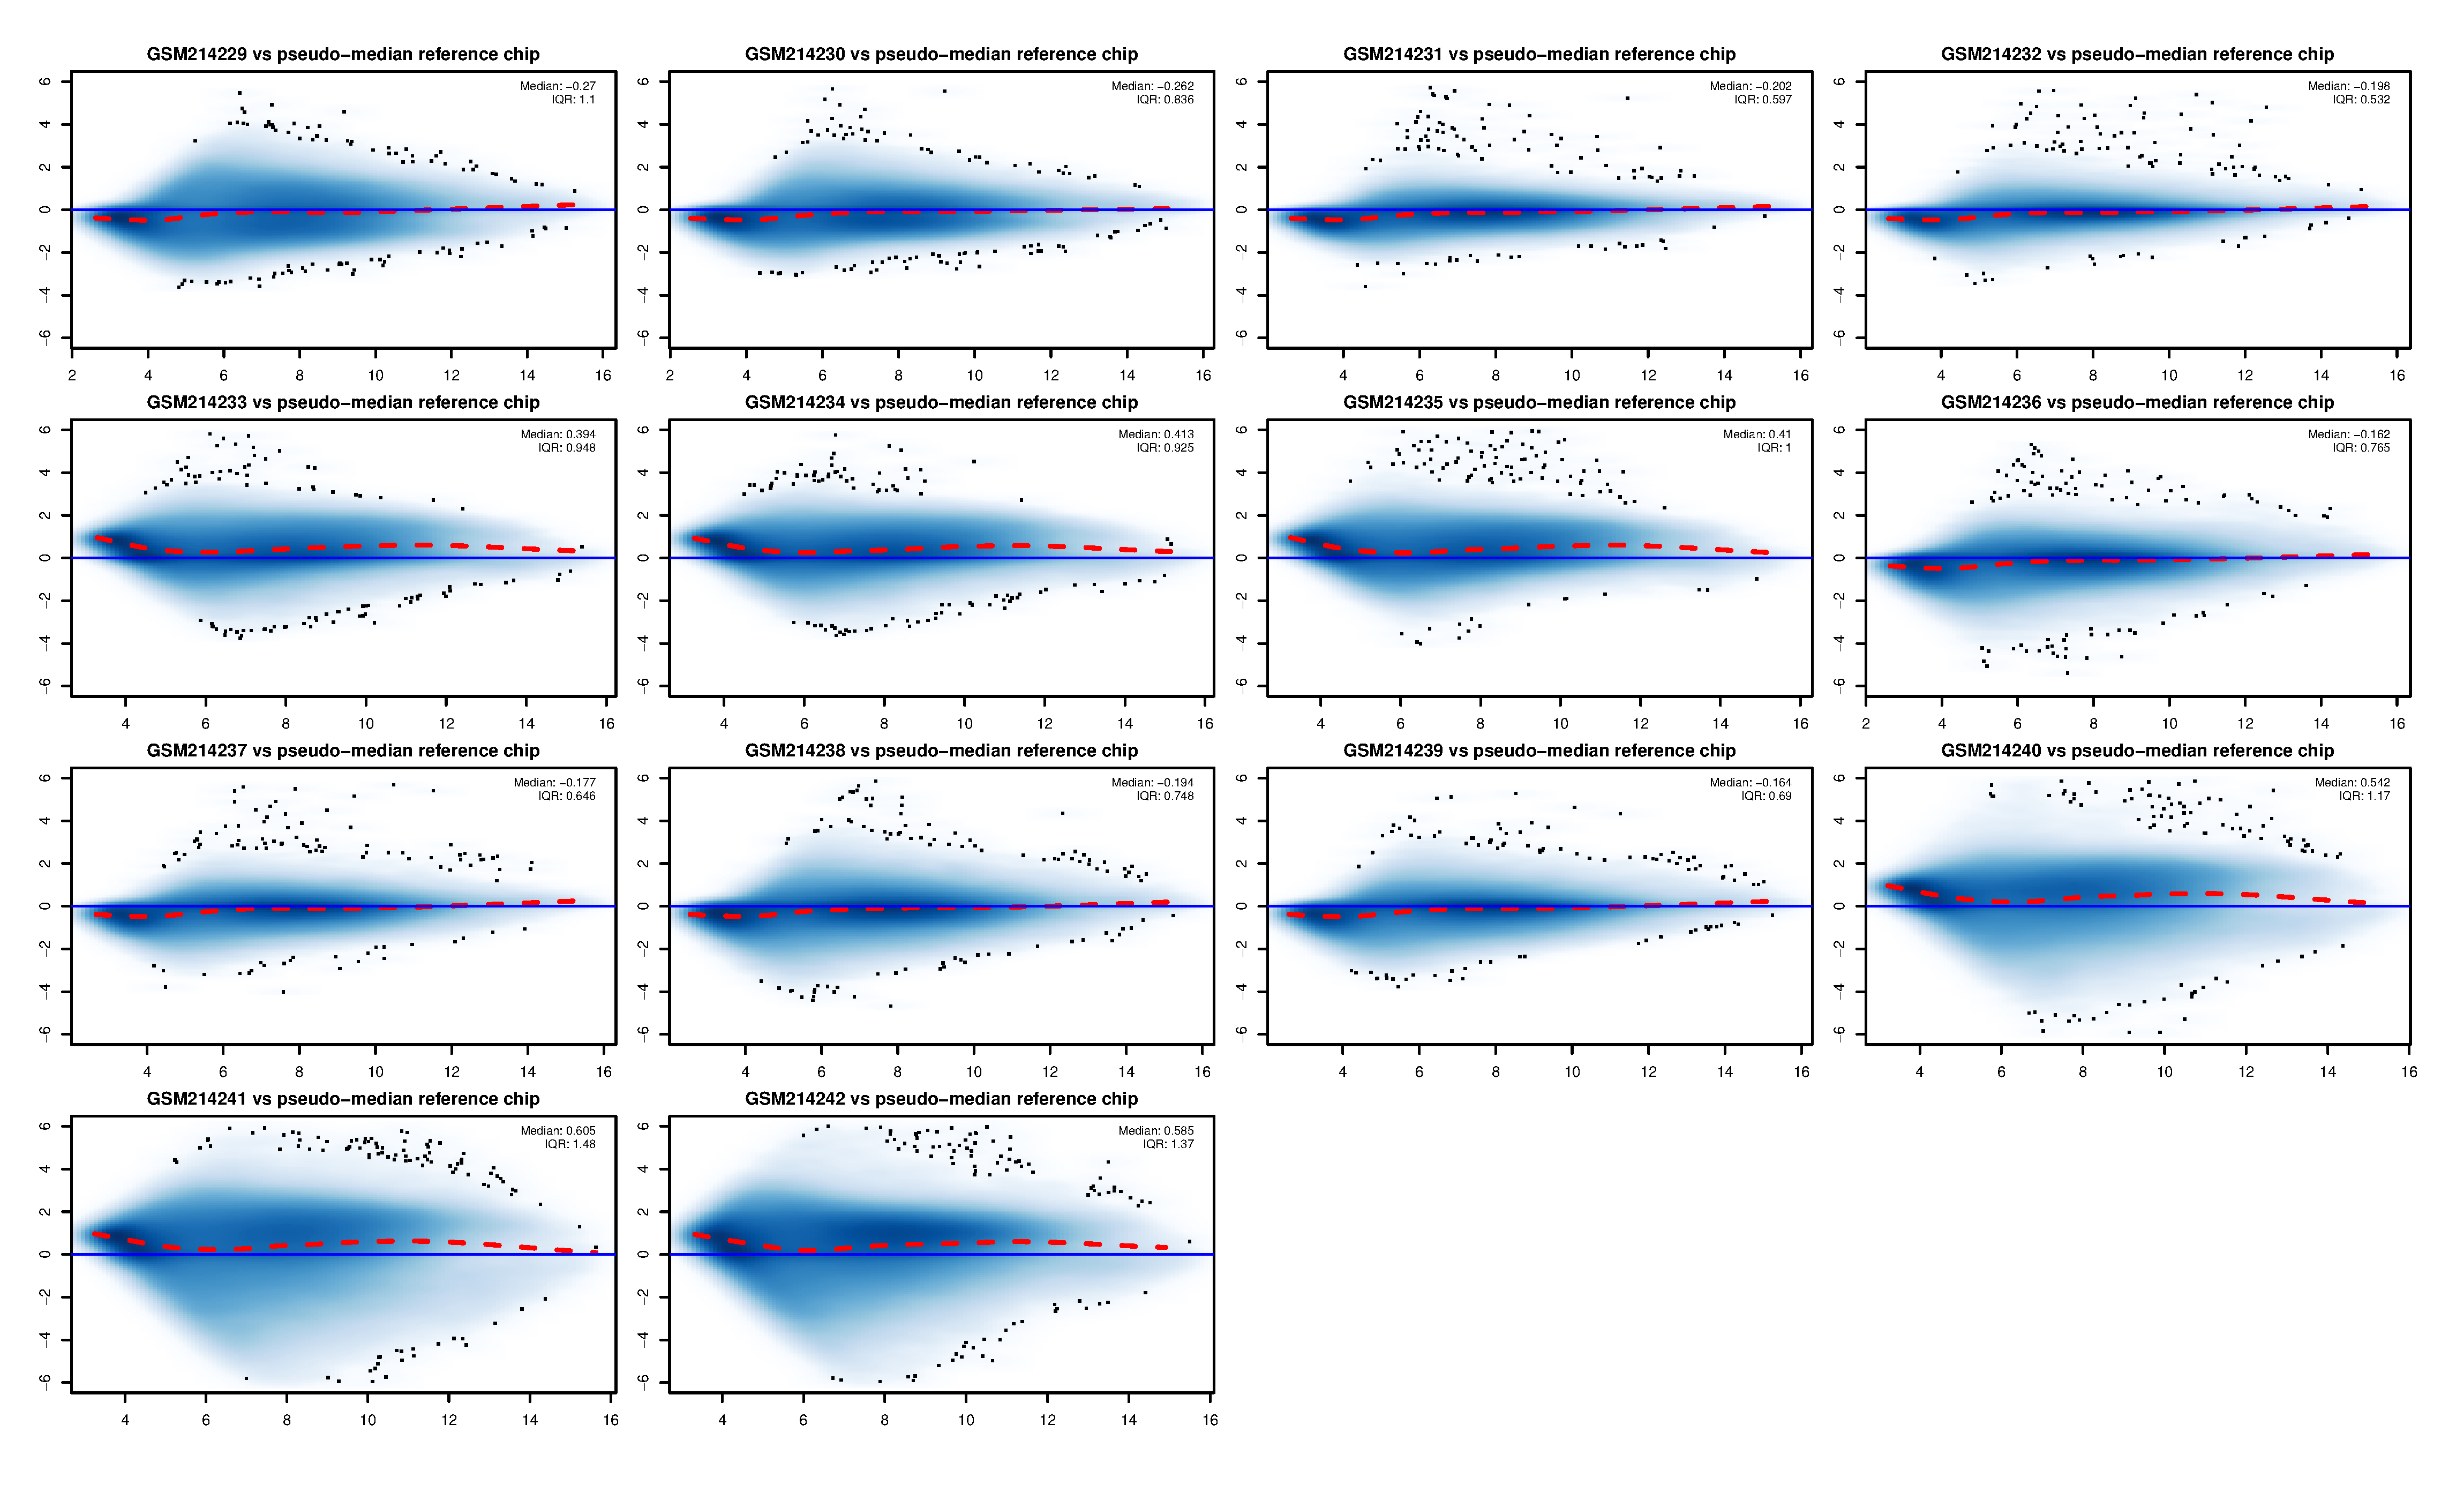
| MAplots | MAplots for each array, raw data |
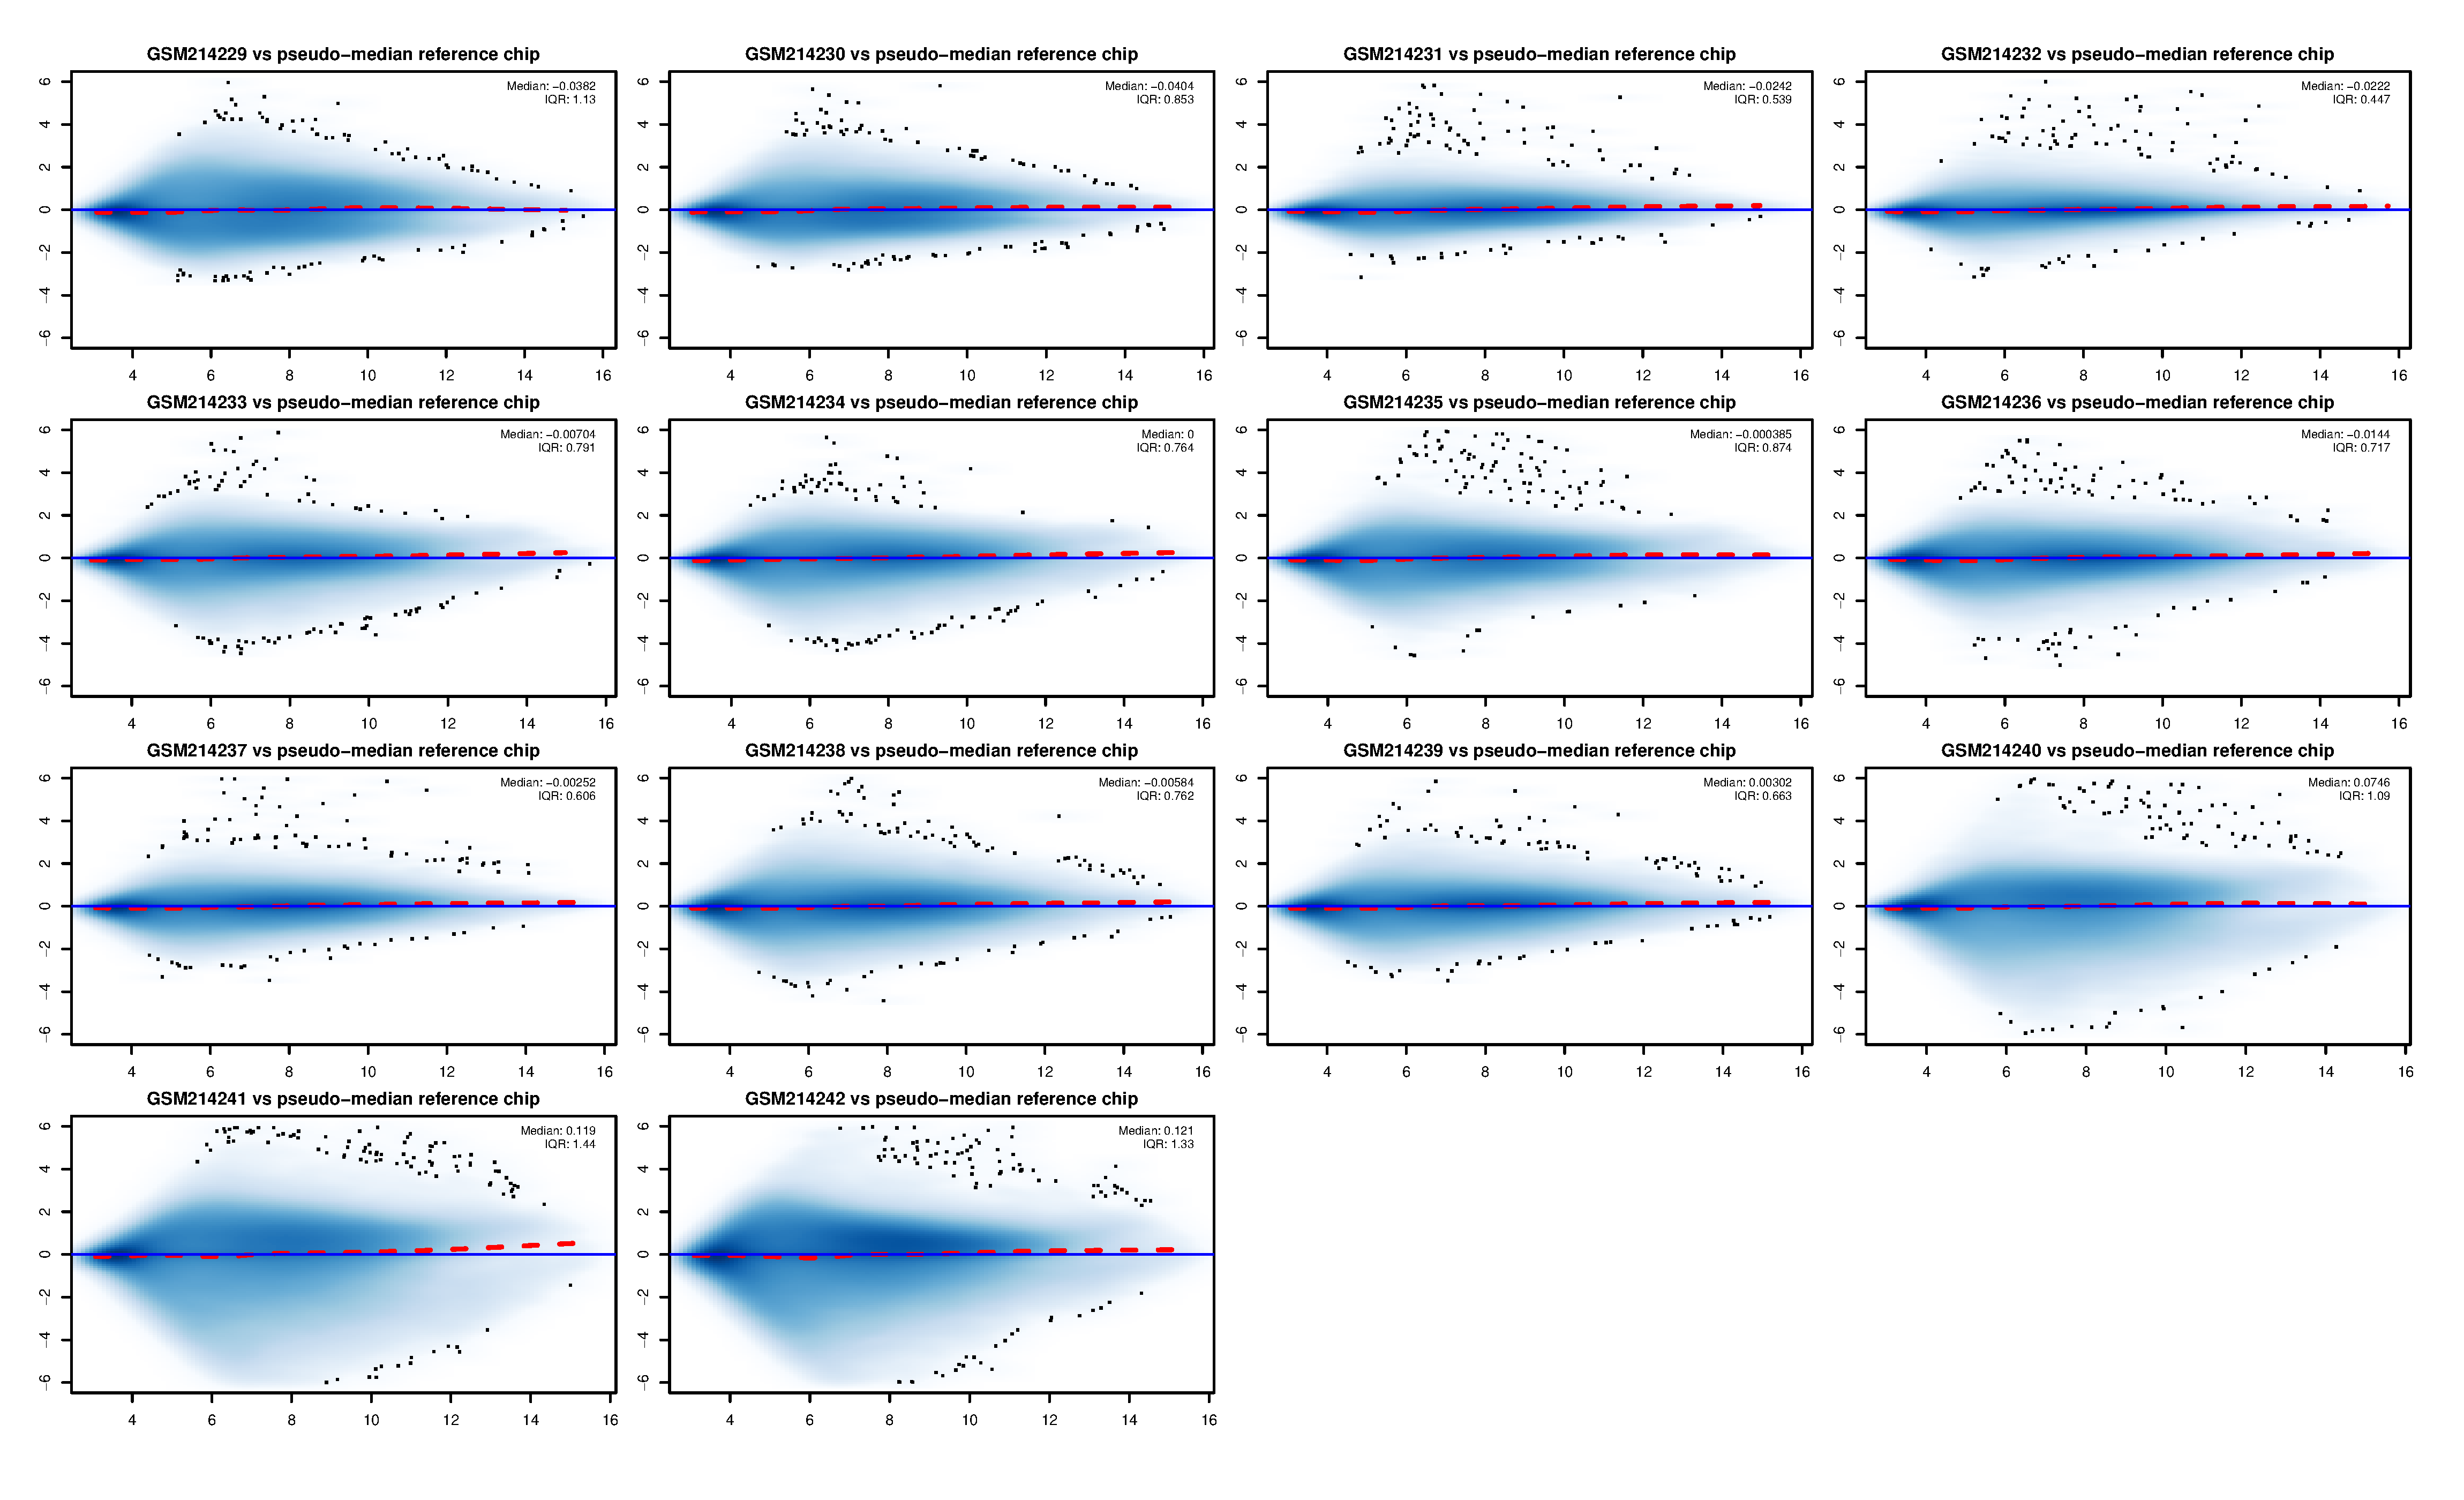
| MAnQplots | MAplots for each array, after RMA normalization |
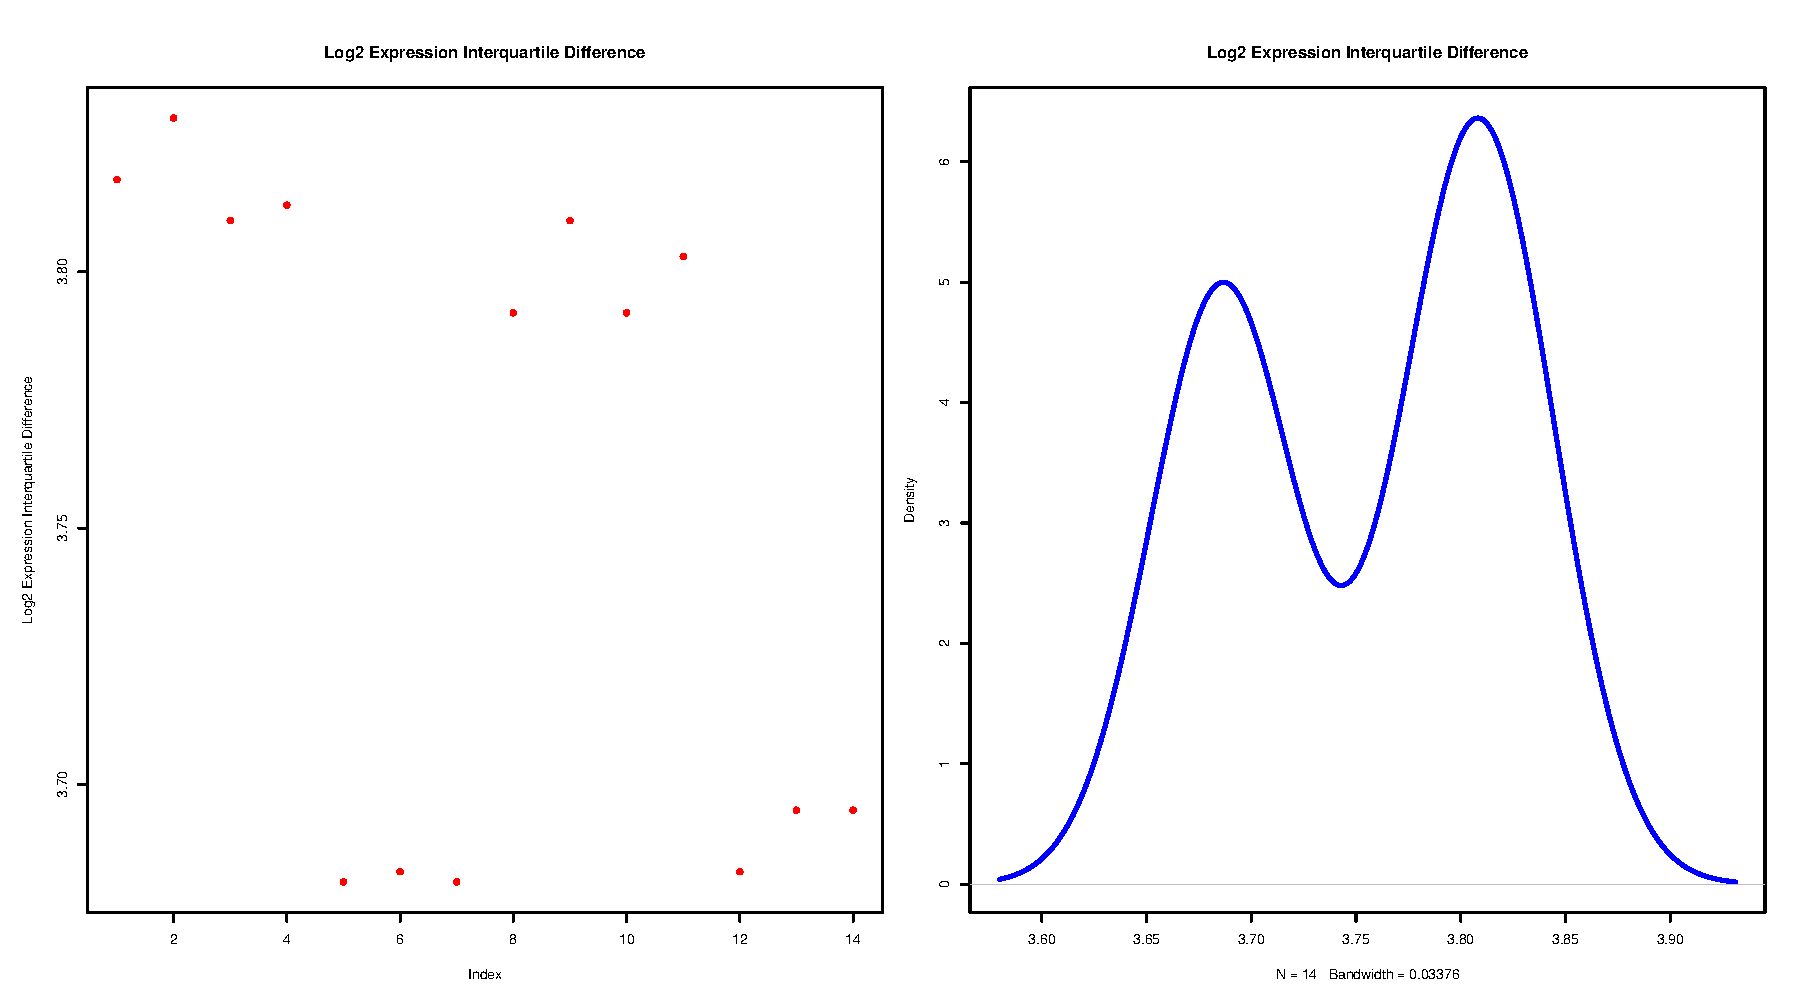
| expIntQuDiff | Interquartile differences of Log2 expression before and after RMA normalization |
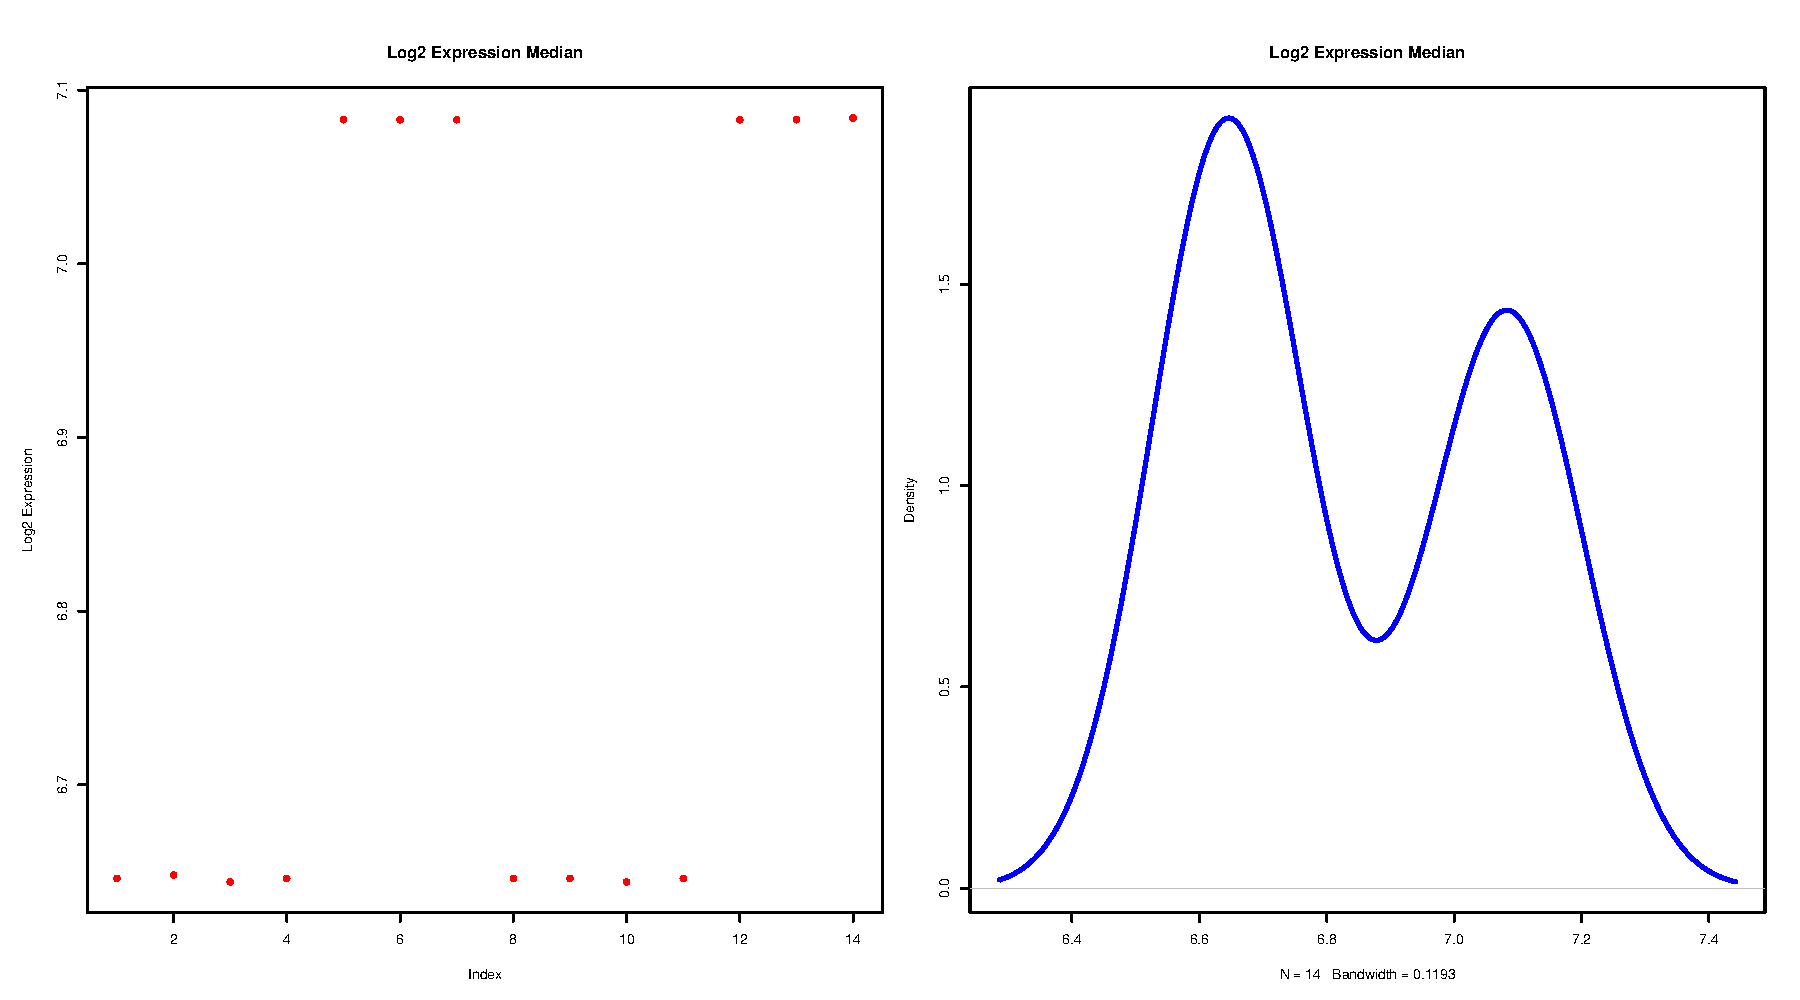
| expMedian | Medians of Log2 expression Medians of Log2 expression |
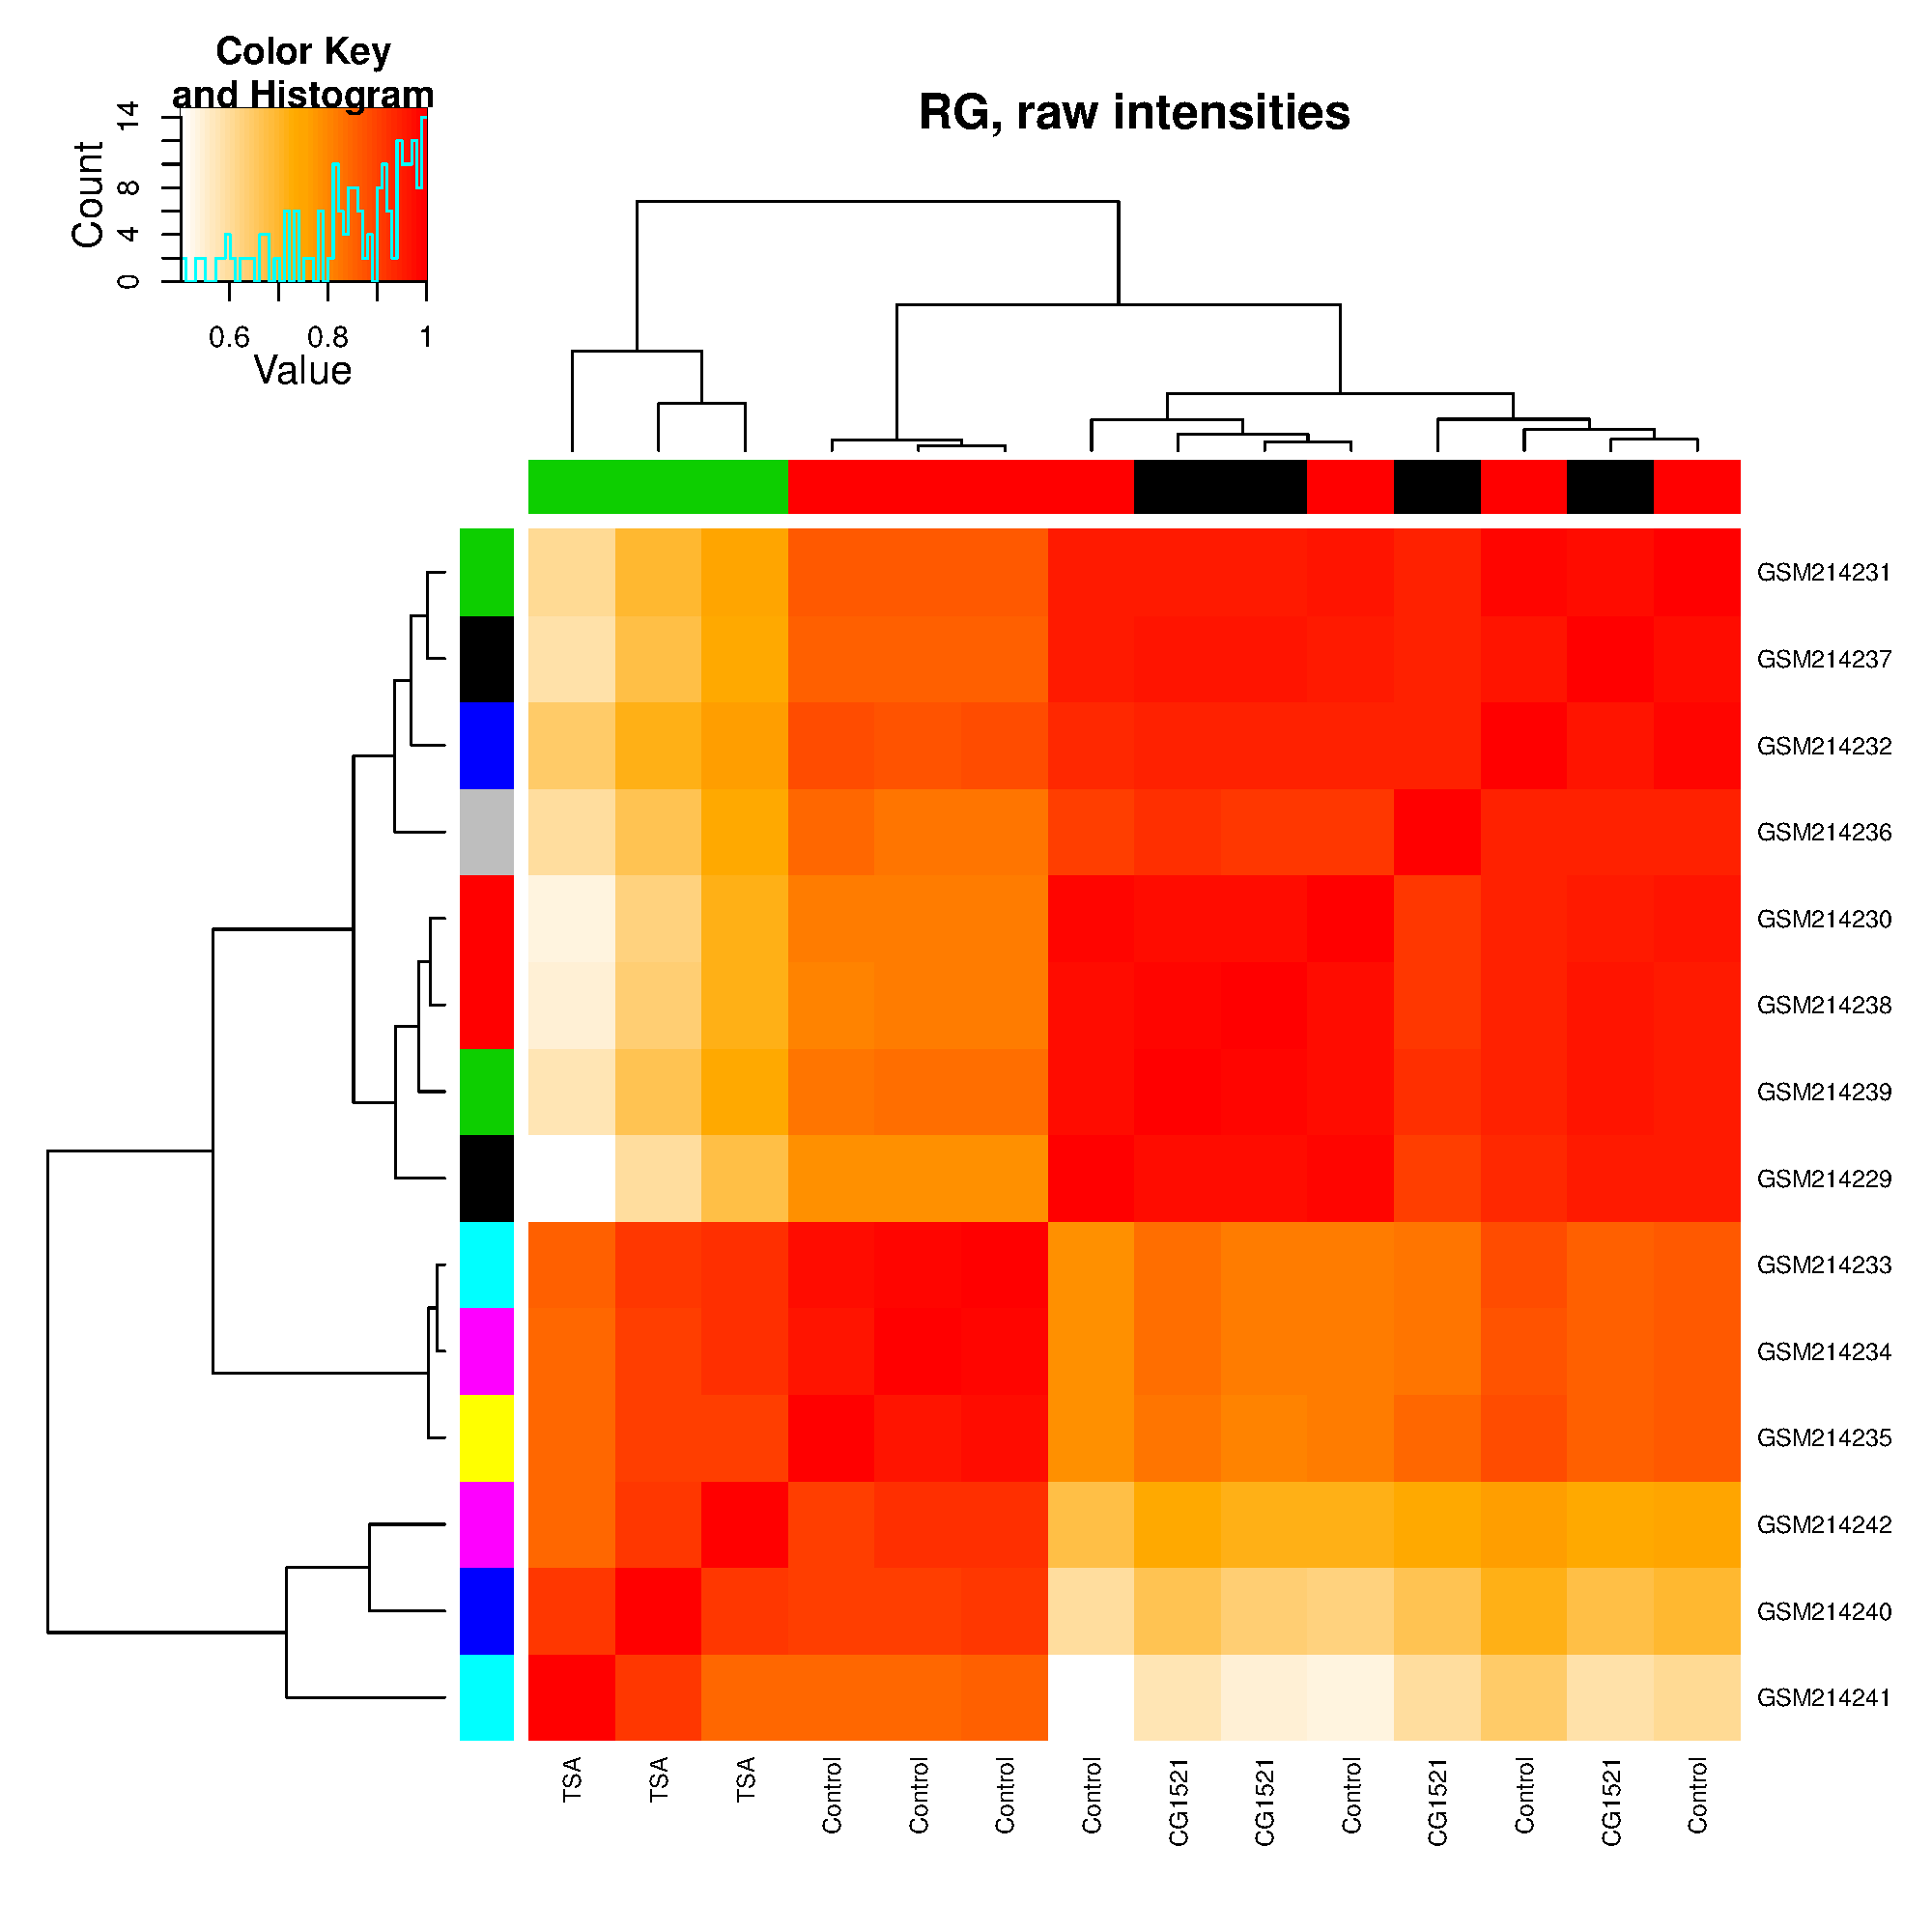
| corrHM.RG | Samples pair-wise correlation heatmap, raw data |
| corrHM.RGnQ | Samples pair-wise correlation heatmap, RMA normalized data |
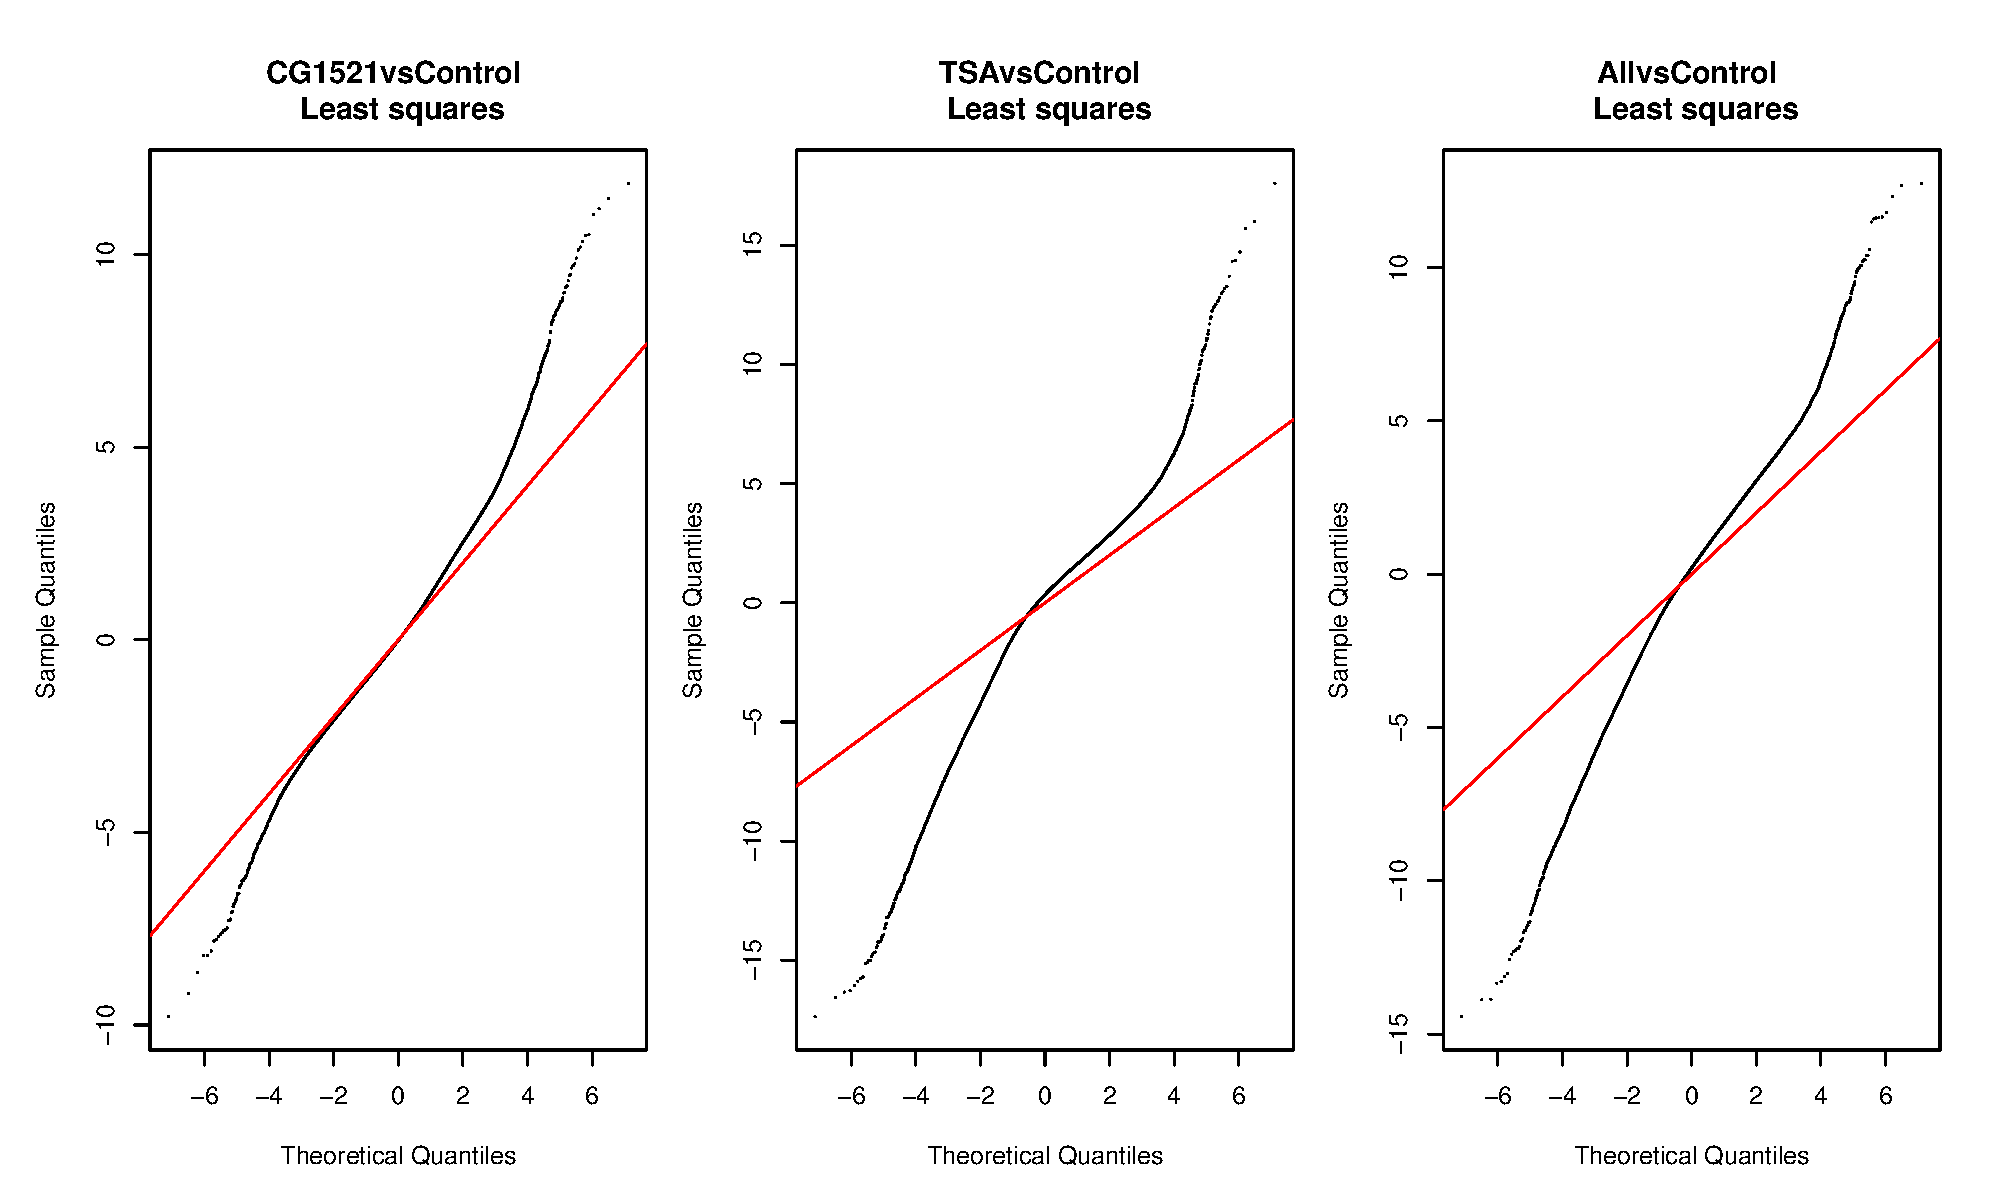
| qqPlots | QQ-plot for each contrast (least squares method) |
| contrasts.BvsM | Volcano plots for each performed comparison |
| contrasts.MAplot | MAplots for each performed comparison |