| FileName | Description |
|---|---|
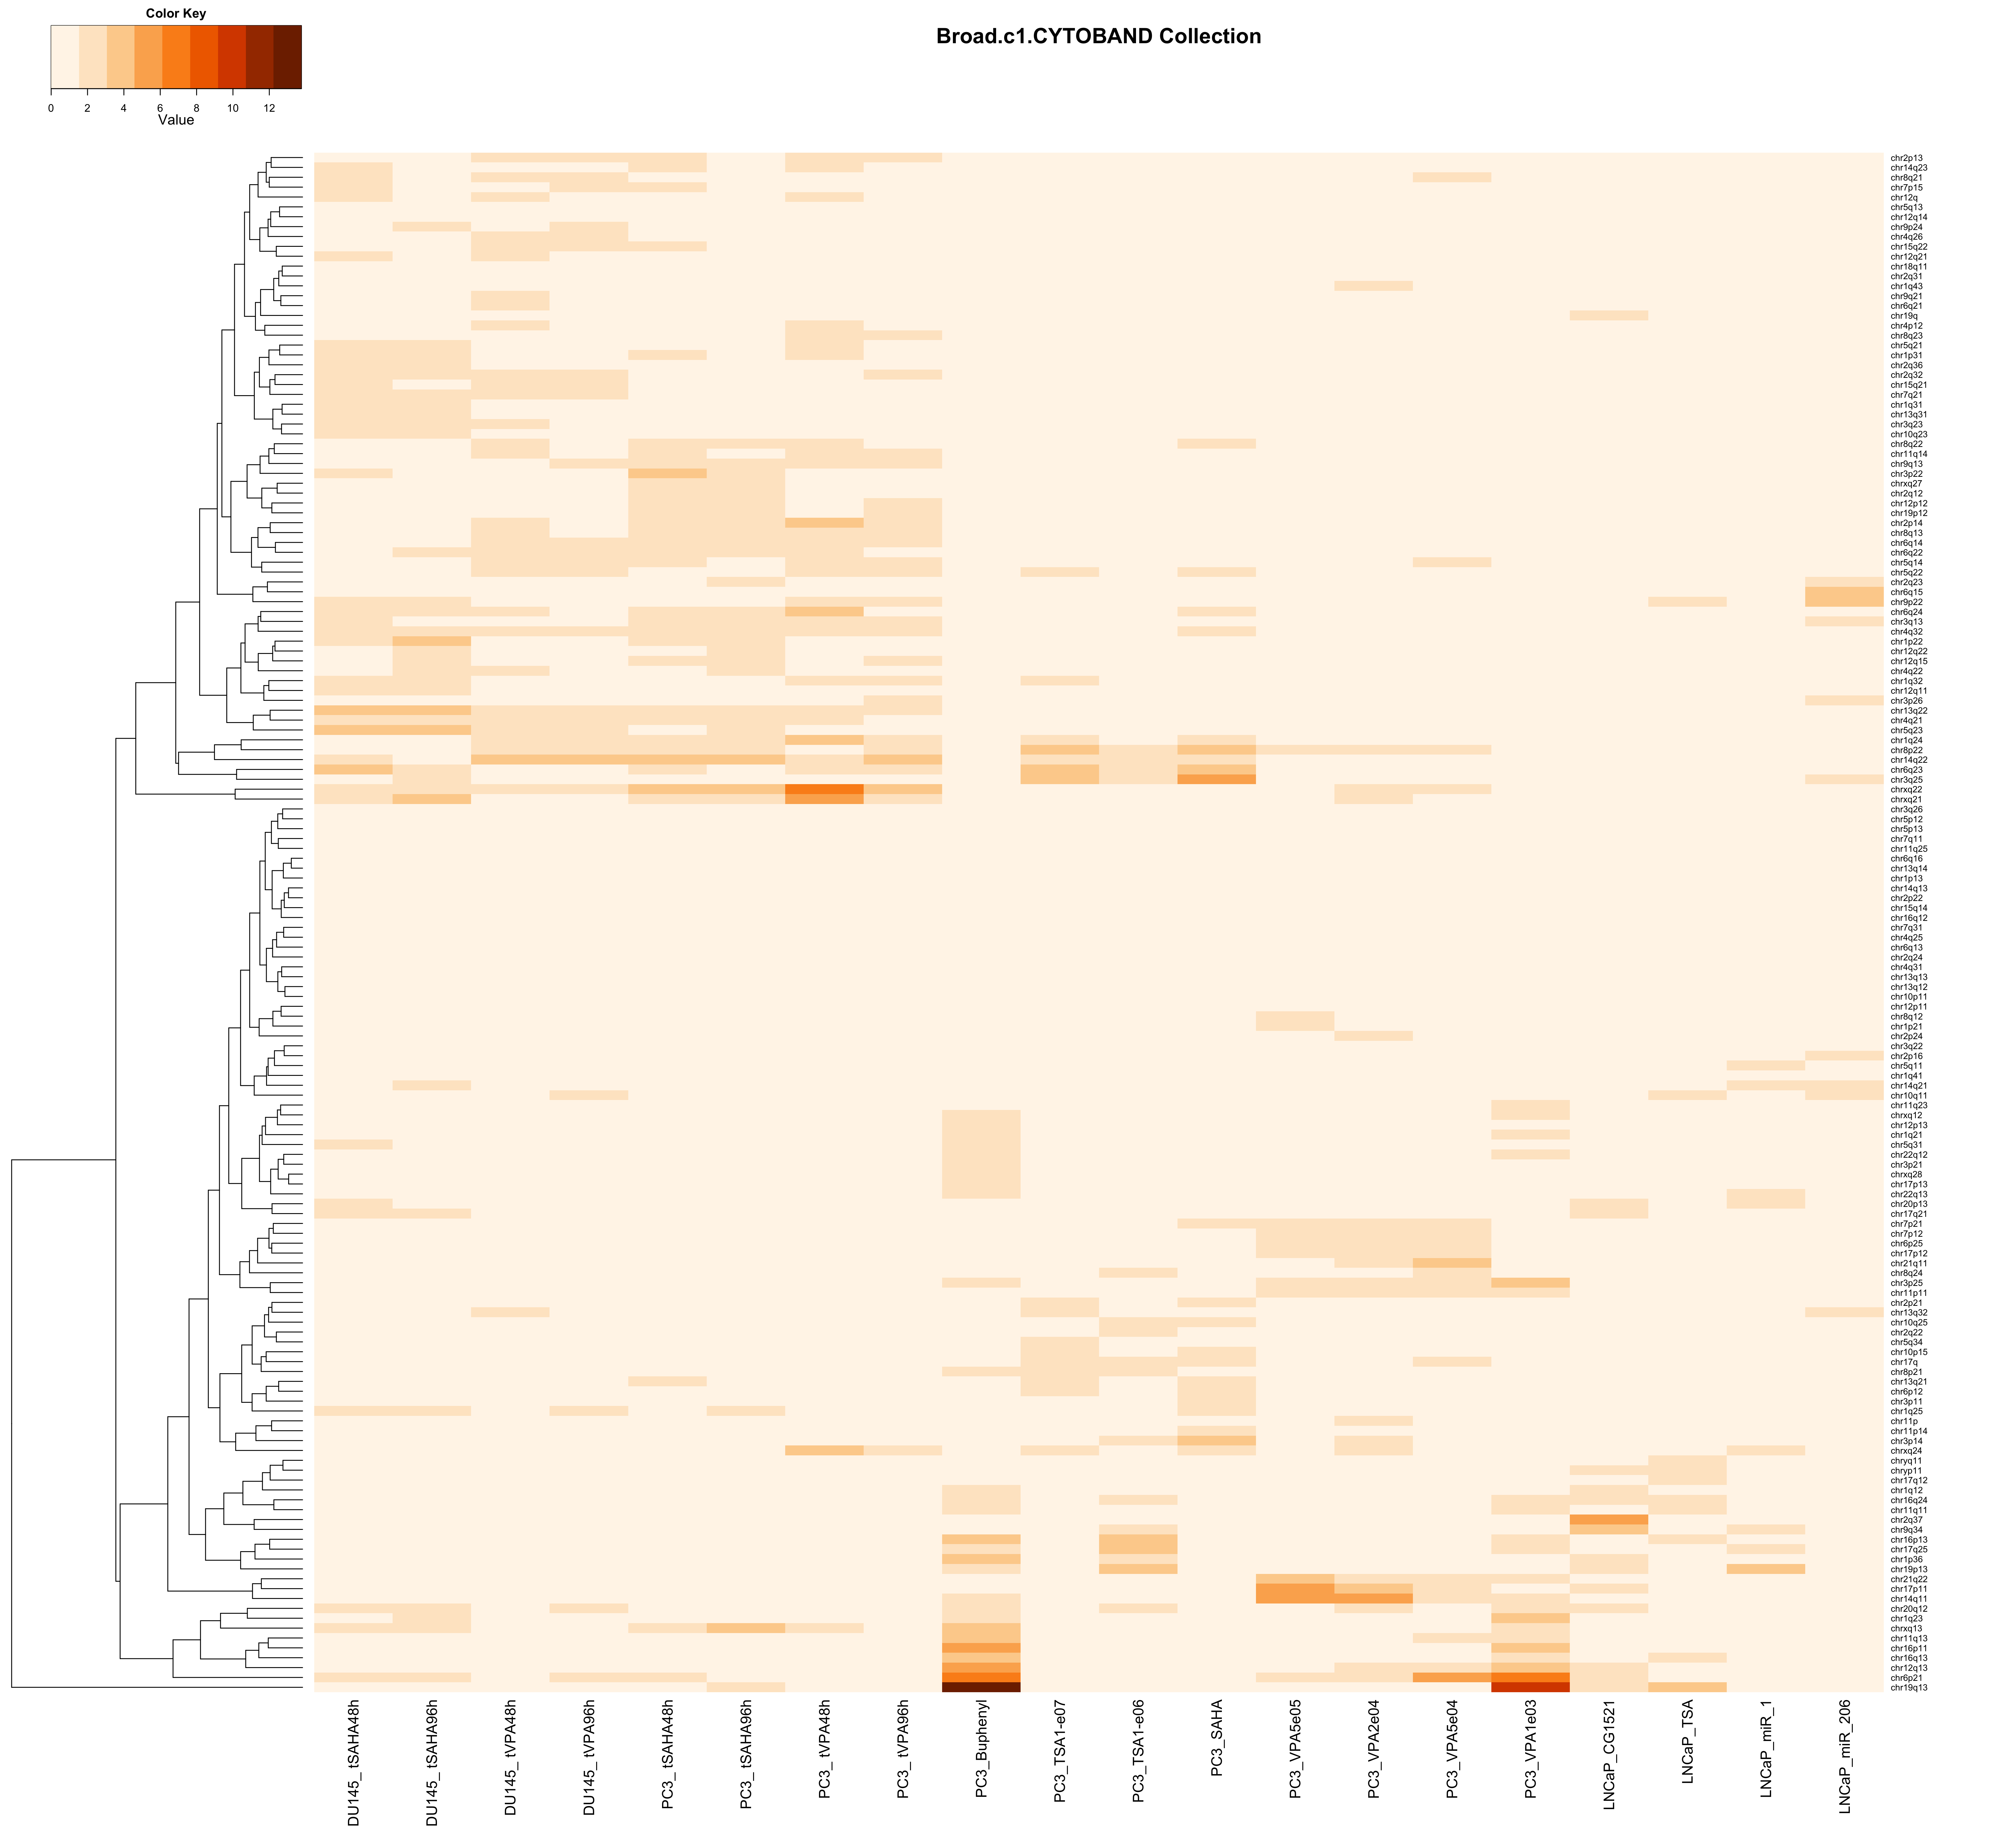
| upMax.Broad.c1.CYTOBAND | Analysis of Functional Annotation for up-regulation; heatmap of the top 200 FGS enriched in at least one contrast (FDR < 0.01); the color scale represents the number of decimal digits of the unadjusted p-values from the Wlcoxon rank-sum test; results for upMax.Broad.c1.CYTOBAND |
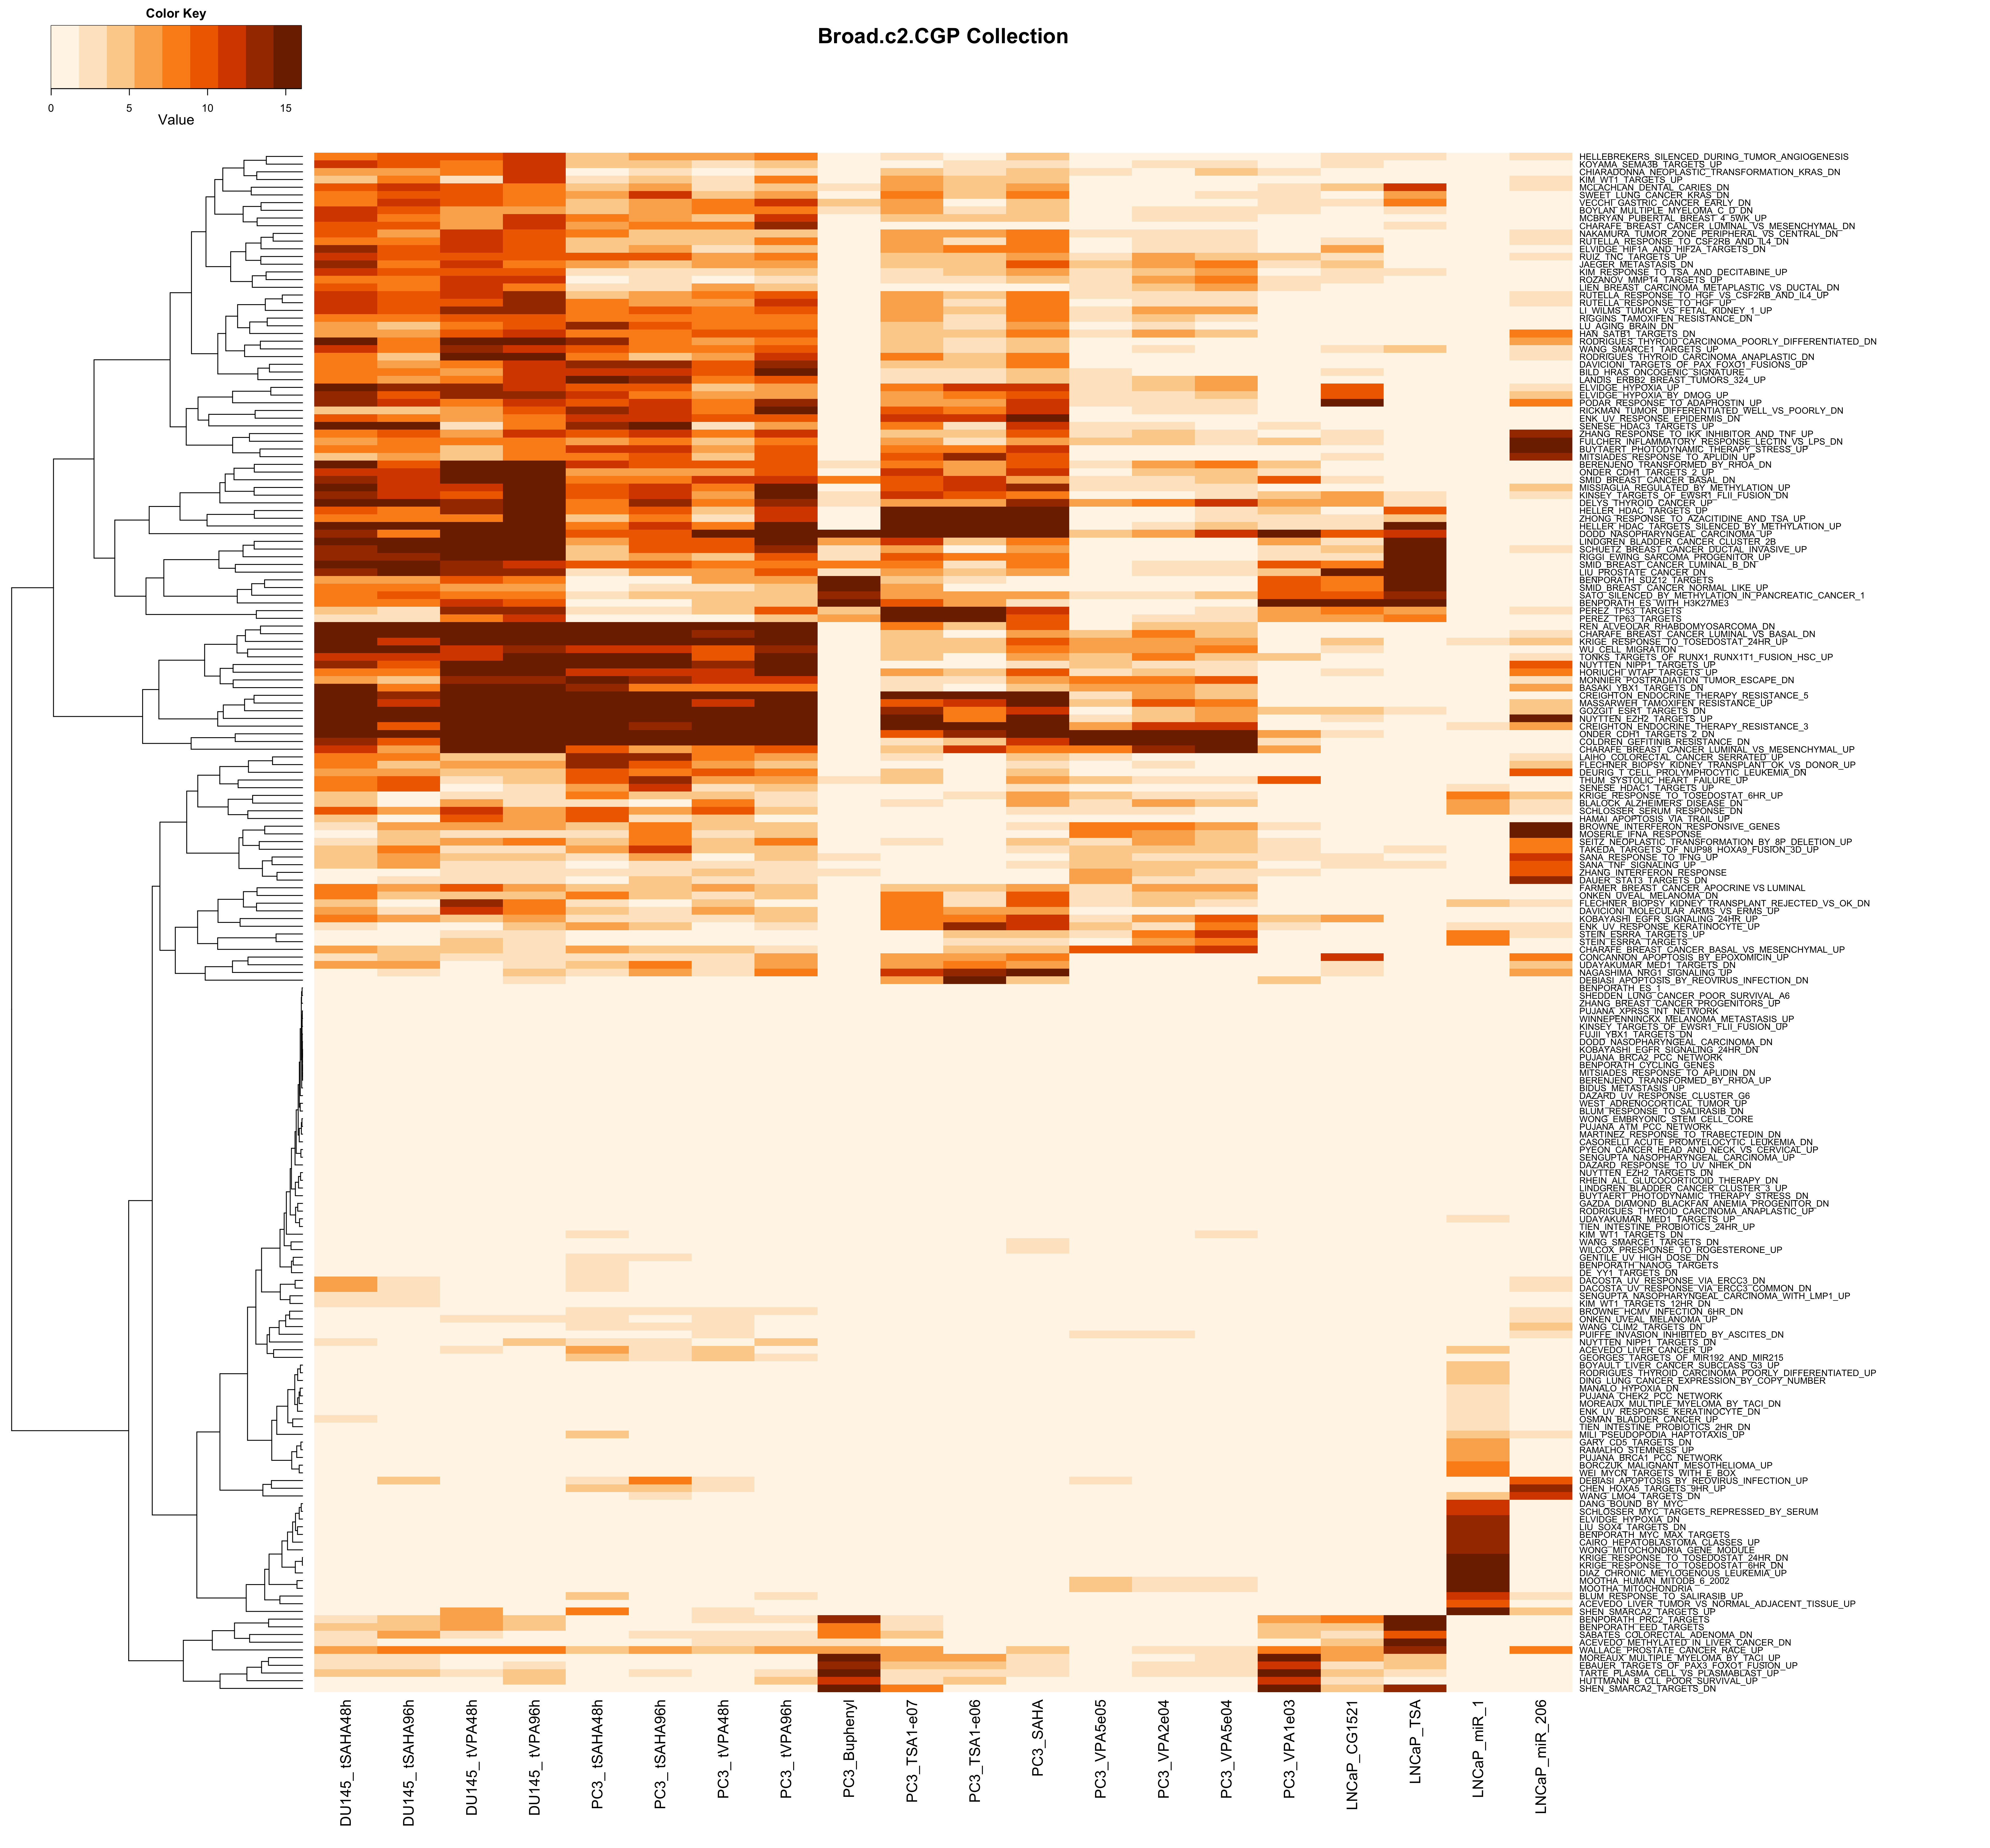
| upMax.Broad.c2.CGP | Analysis of Functional Annotation for up-regulation; heatmap of the top 200 FGS enriched in at least one contrast (FDR < 0.01); the color scale represents the number of decimal digits of the unadjusted p-values from the Wlcoxon rank-sum test; results for upMax.Broad.c2.CGP |
| upMax.Broad.c2.CP | Analysis of Functional Annotation for up-regulation; heatmap of the top 200 FGS enriched in at least one contrast (FDR < 0.01); the color scale represents the number of decimal digits of the unadjusted p-values from the Wlcoxon rank-sum test; results for upMax.Broad.c2.CP |
| upMax.Broad.c2.CP.BIOCARTA | Analysis of Functional Annotation for up-regulation; heatmap of the top 200 FGS enriched in at least one contrast (FDR < 0.01); the color scale represents the number of decimal digits of the unadjusted p-values from the Wlcoxon rank-sum test; results for upMax.Broad.c2.CP.BIOCARTA |
| upMax.Broad.c2.CP.KEGG | Analysis of Functional Annotation for up-regulation; heatmap of the top 200 FGS enriched in at least one contrast (FDR < 0.01); the color scale represents the number of decimal digits of the unadjusted p-values from the Wlcoxon rank-sum test; results for upMax.Broad.c2.CP.KEGG |
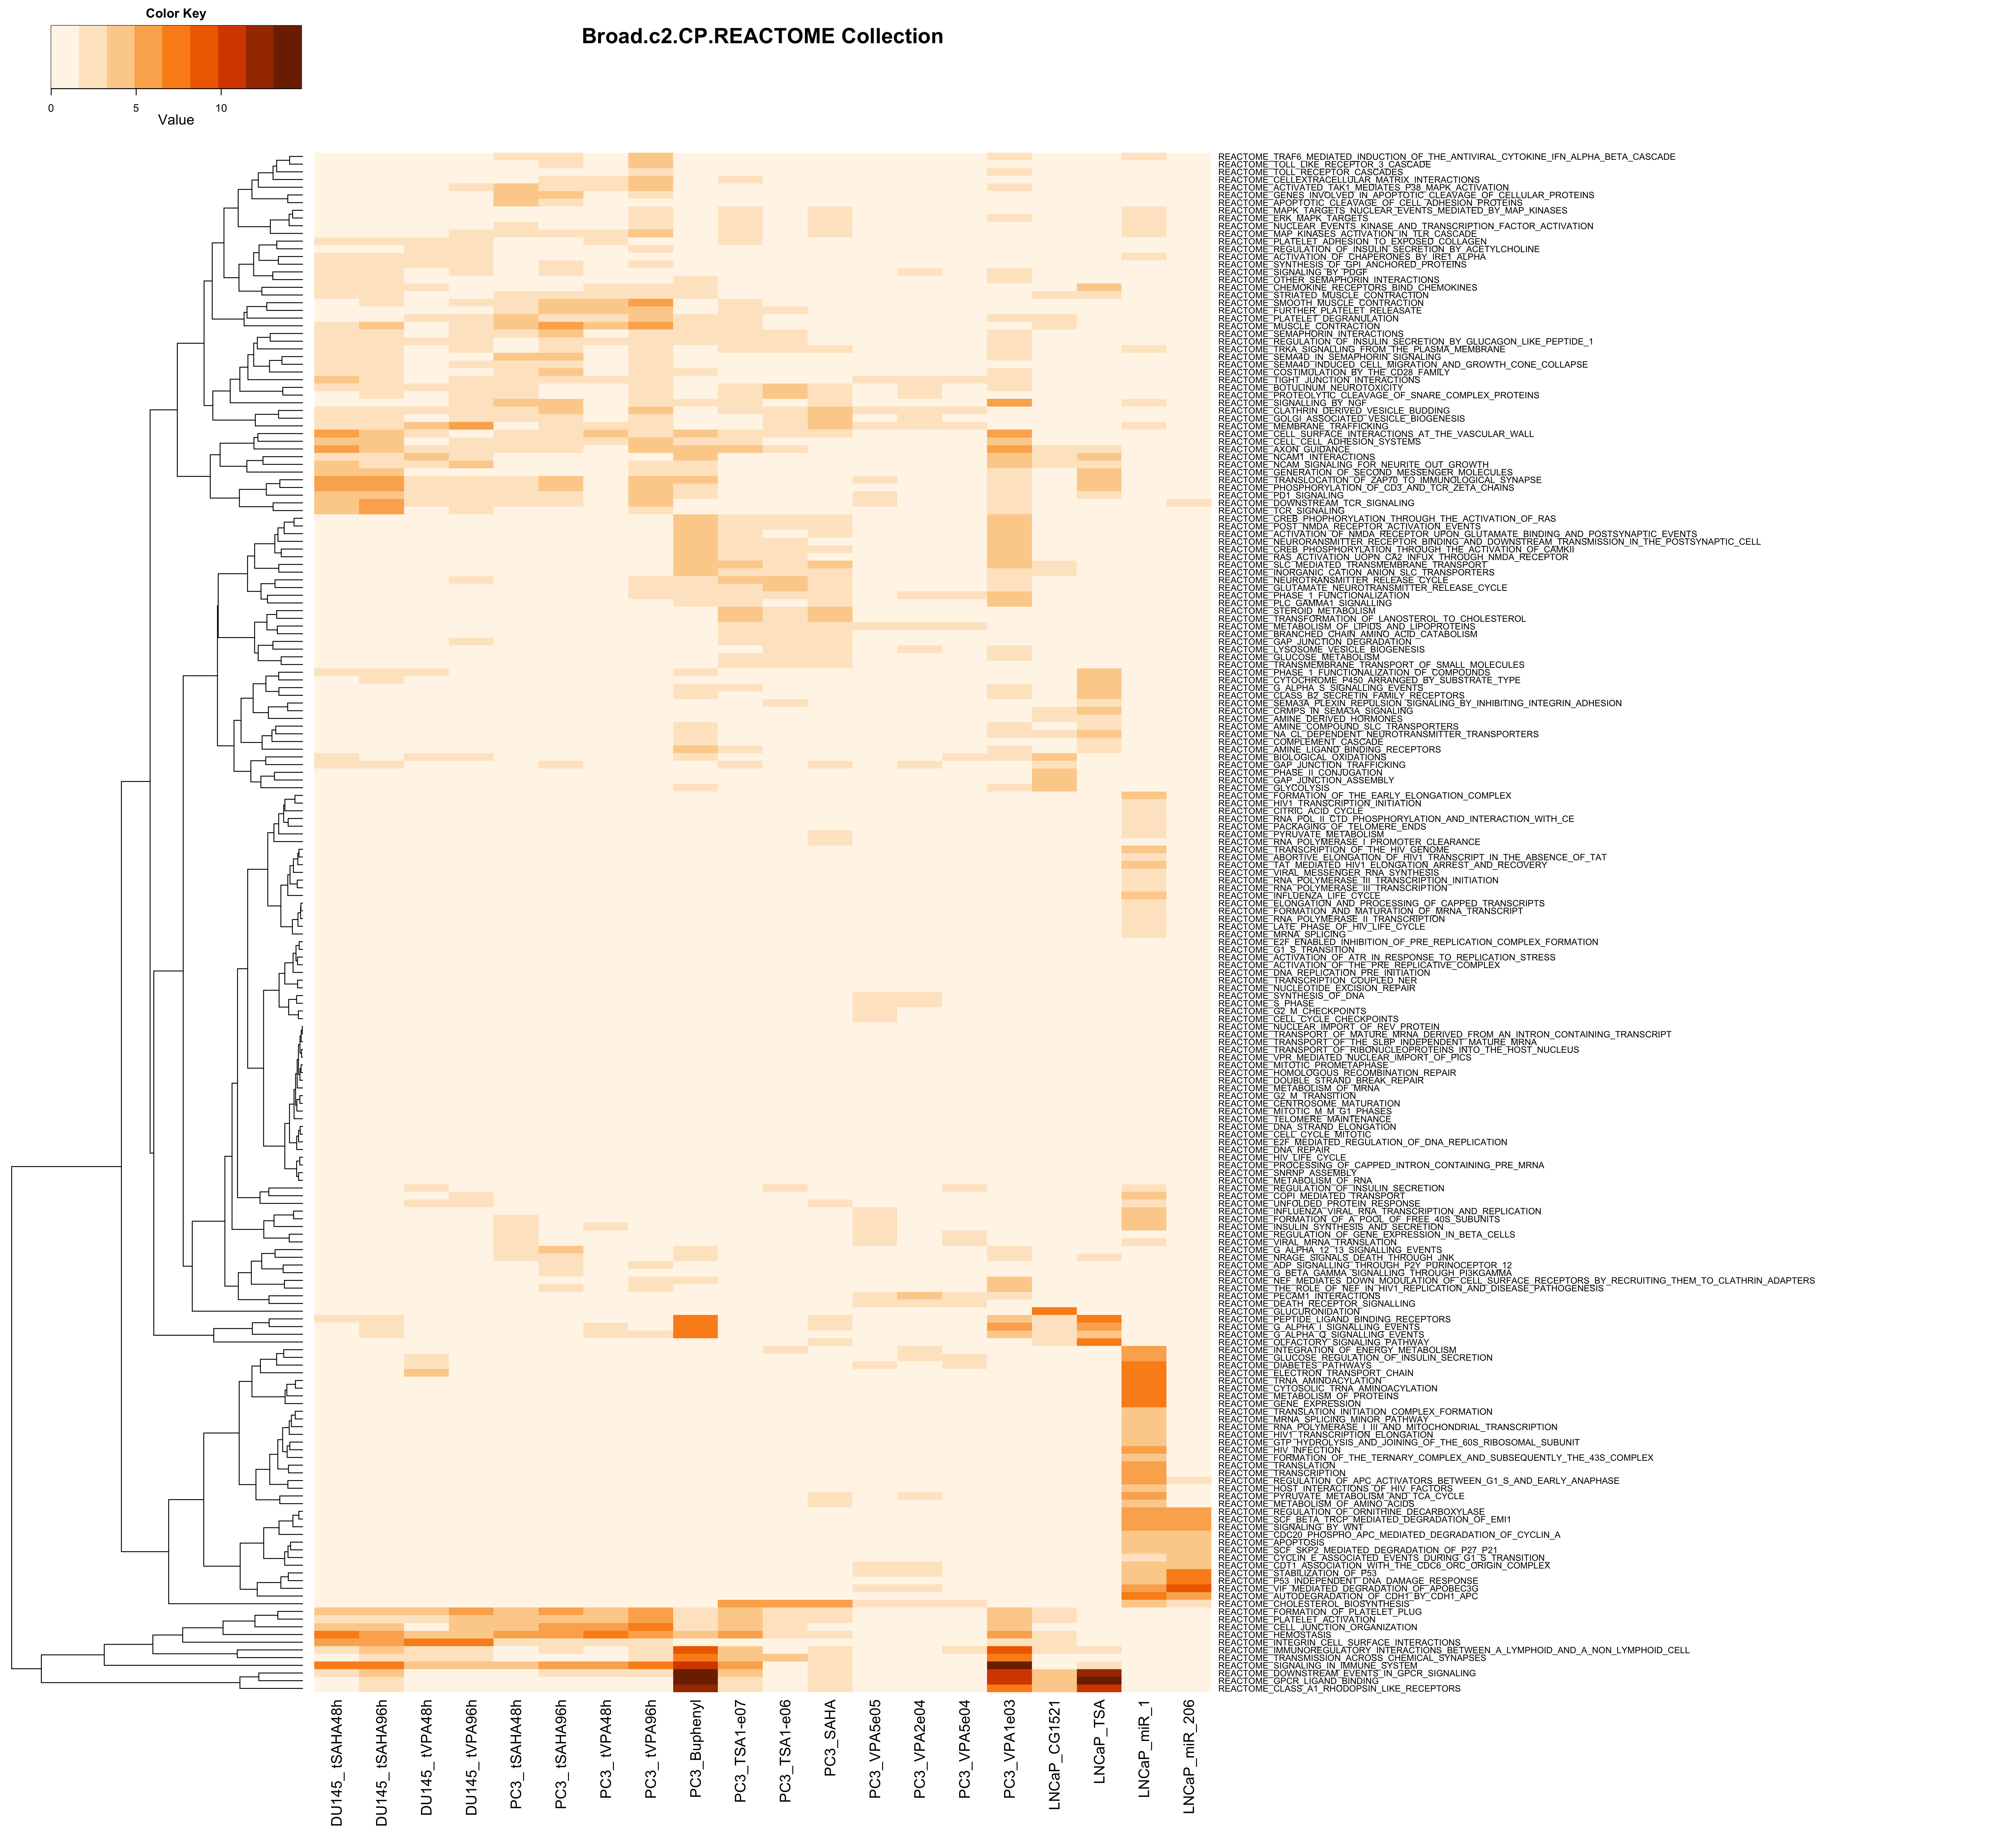
| upMax.Broad.c2.CP.REACTOME | Analysis of Functional Annotation for up-regulation; heatmap of the top 200 FGS enriched in at least one contrast (FDR < 0.01); the color scale represents the number of decimal digits of the unadjusted p-values from the Wlcoxon rank-sum test; results for upMax.Broad.c2.CP.REACTOME |
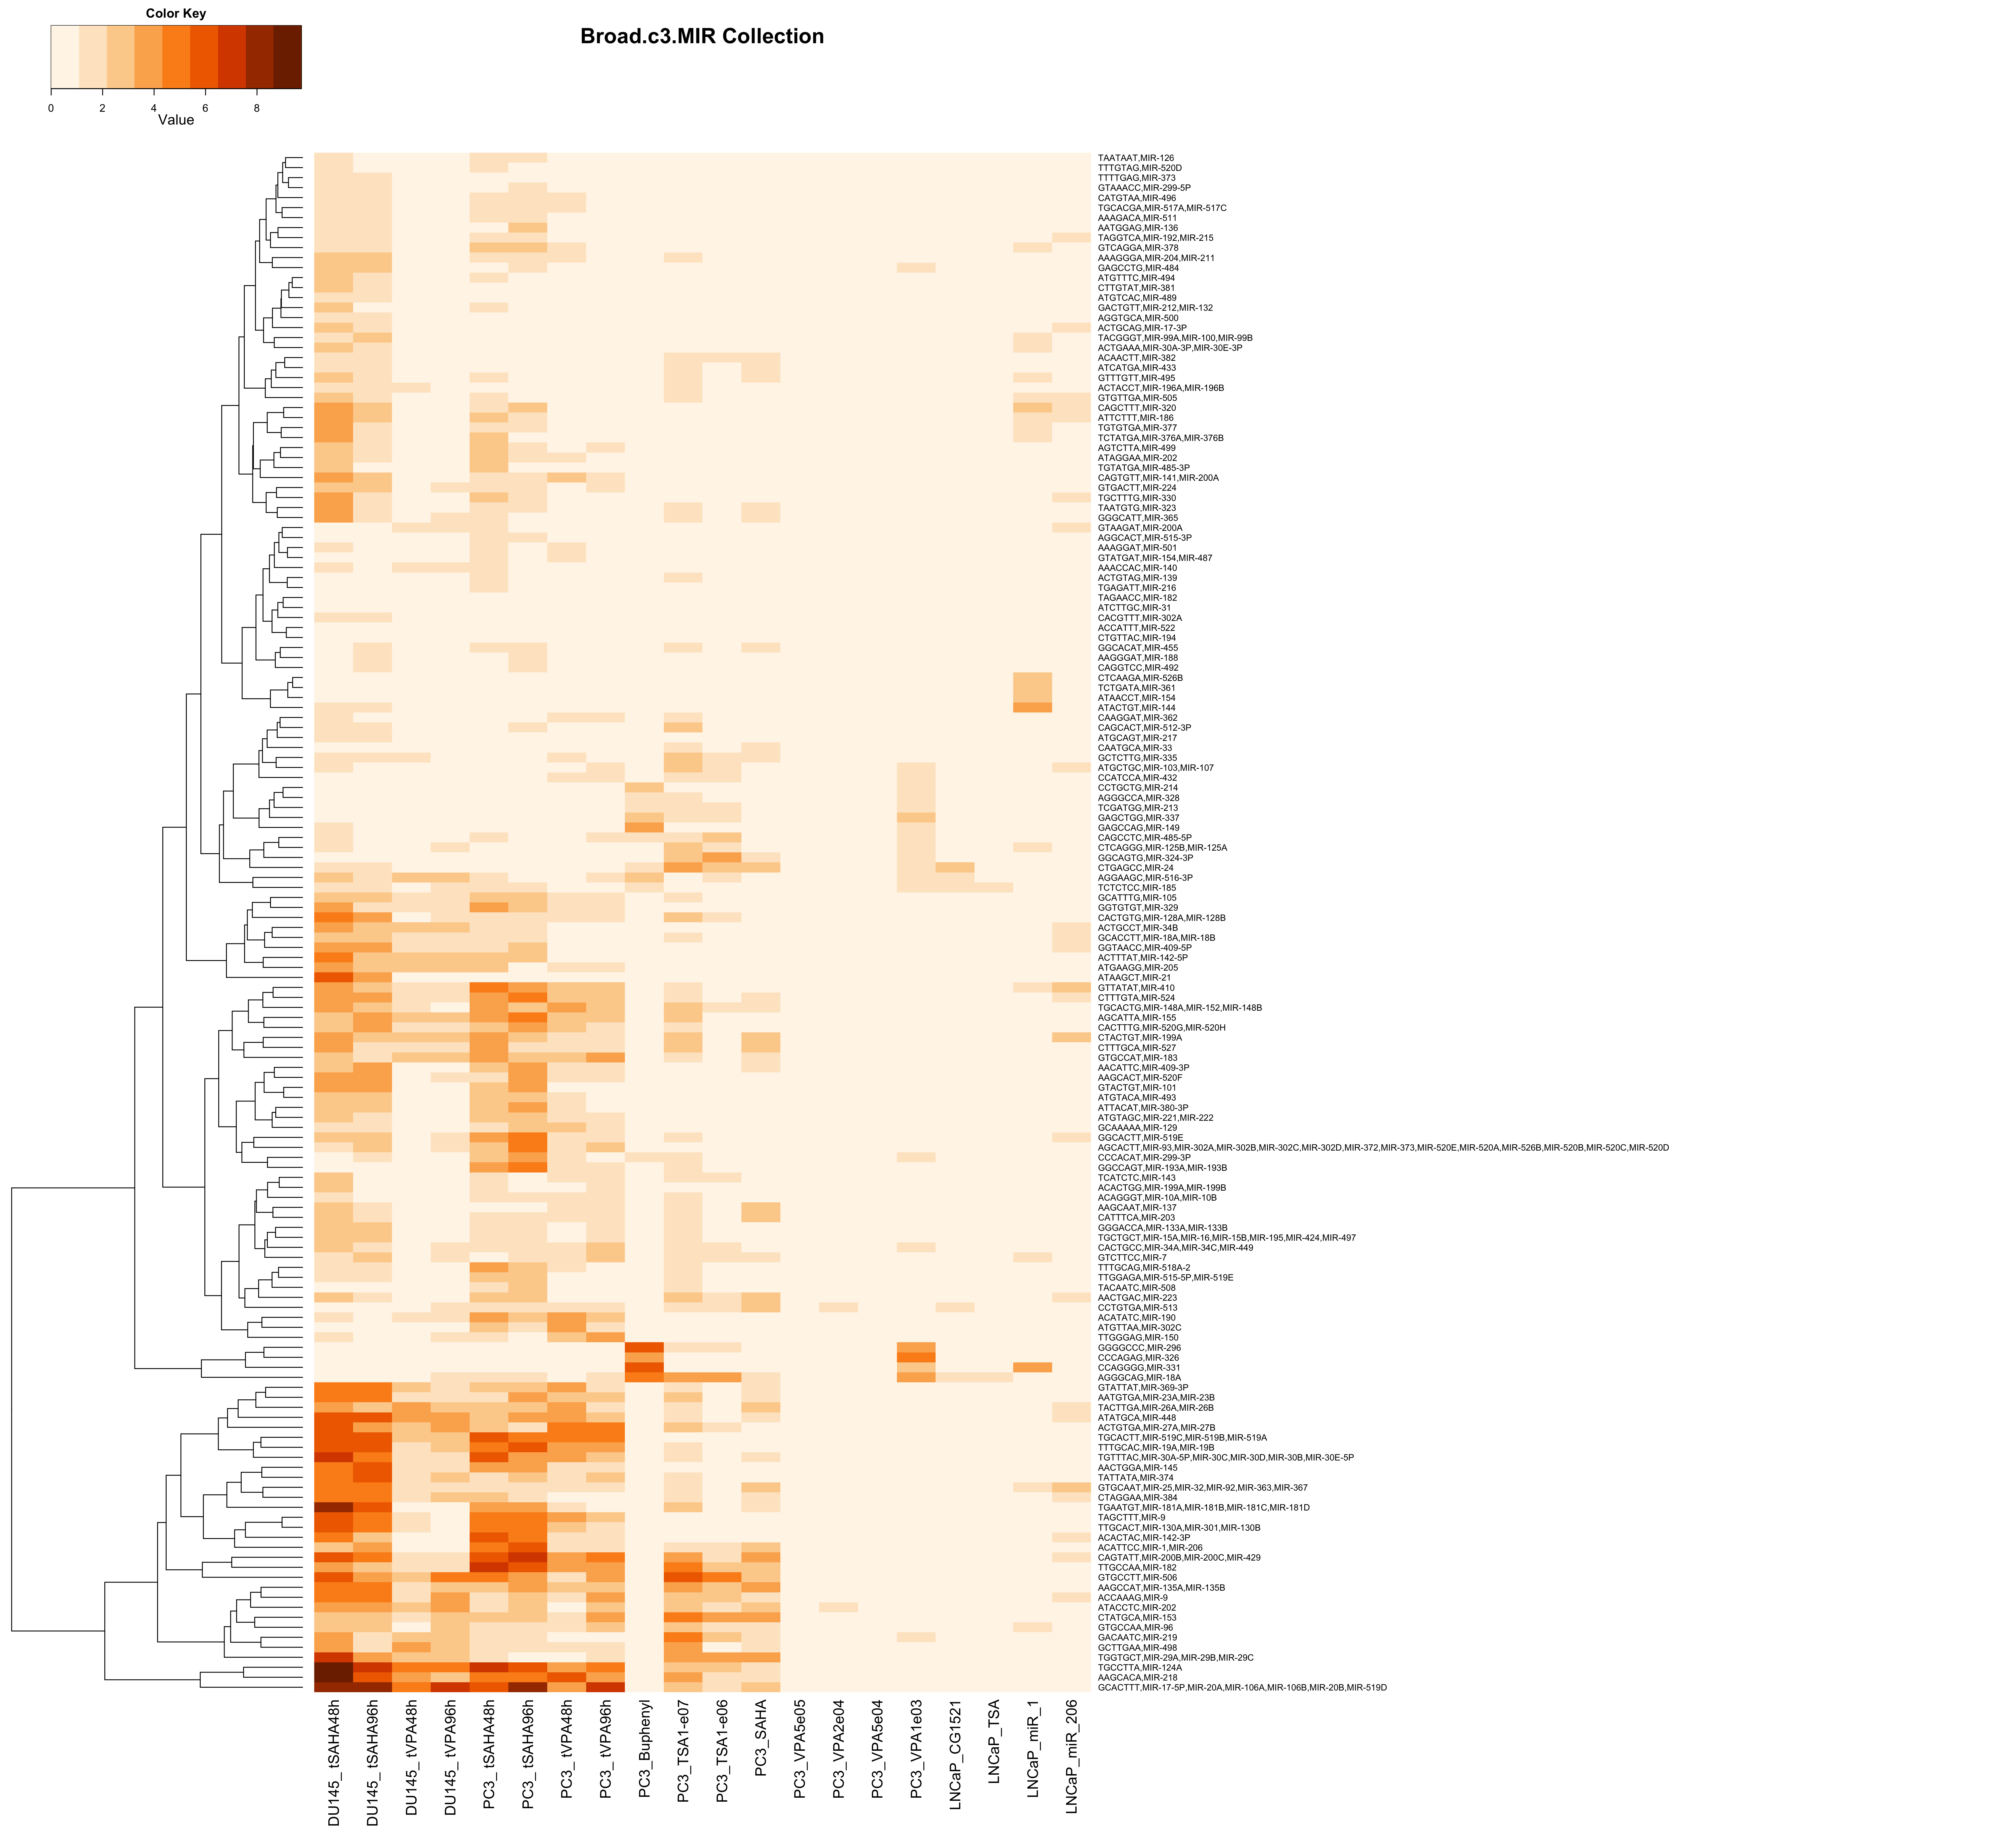
| upMax.Broad.c3.MIR | Analysis of Functional Annotation for up-regulation; heatmap of the top 200 FGS enriched in at least one contrast (FDR < 0.01); the color scale represents the number of decimal digits of the unadjusted p-values from the Wlcoxon rank-sum test; results for upMax.Broad.c3.MIR |
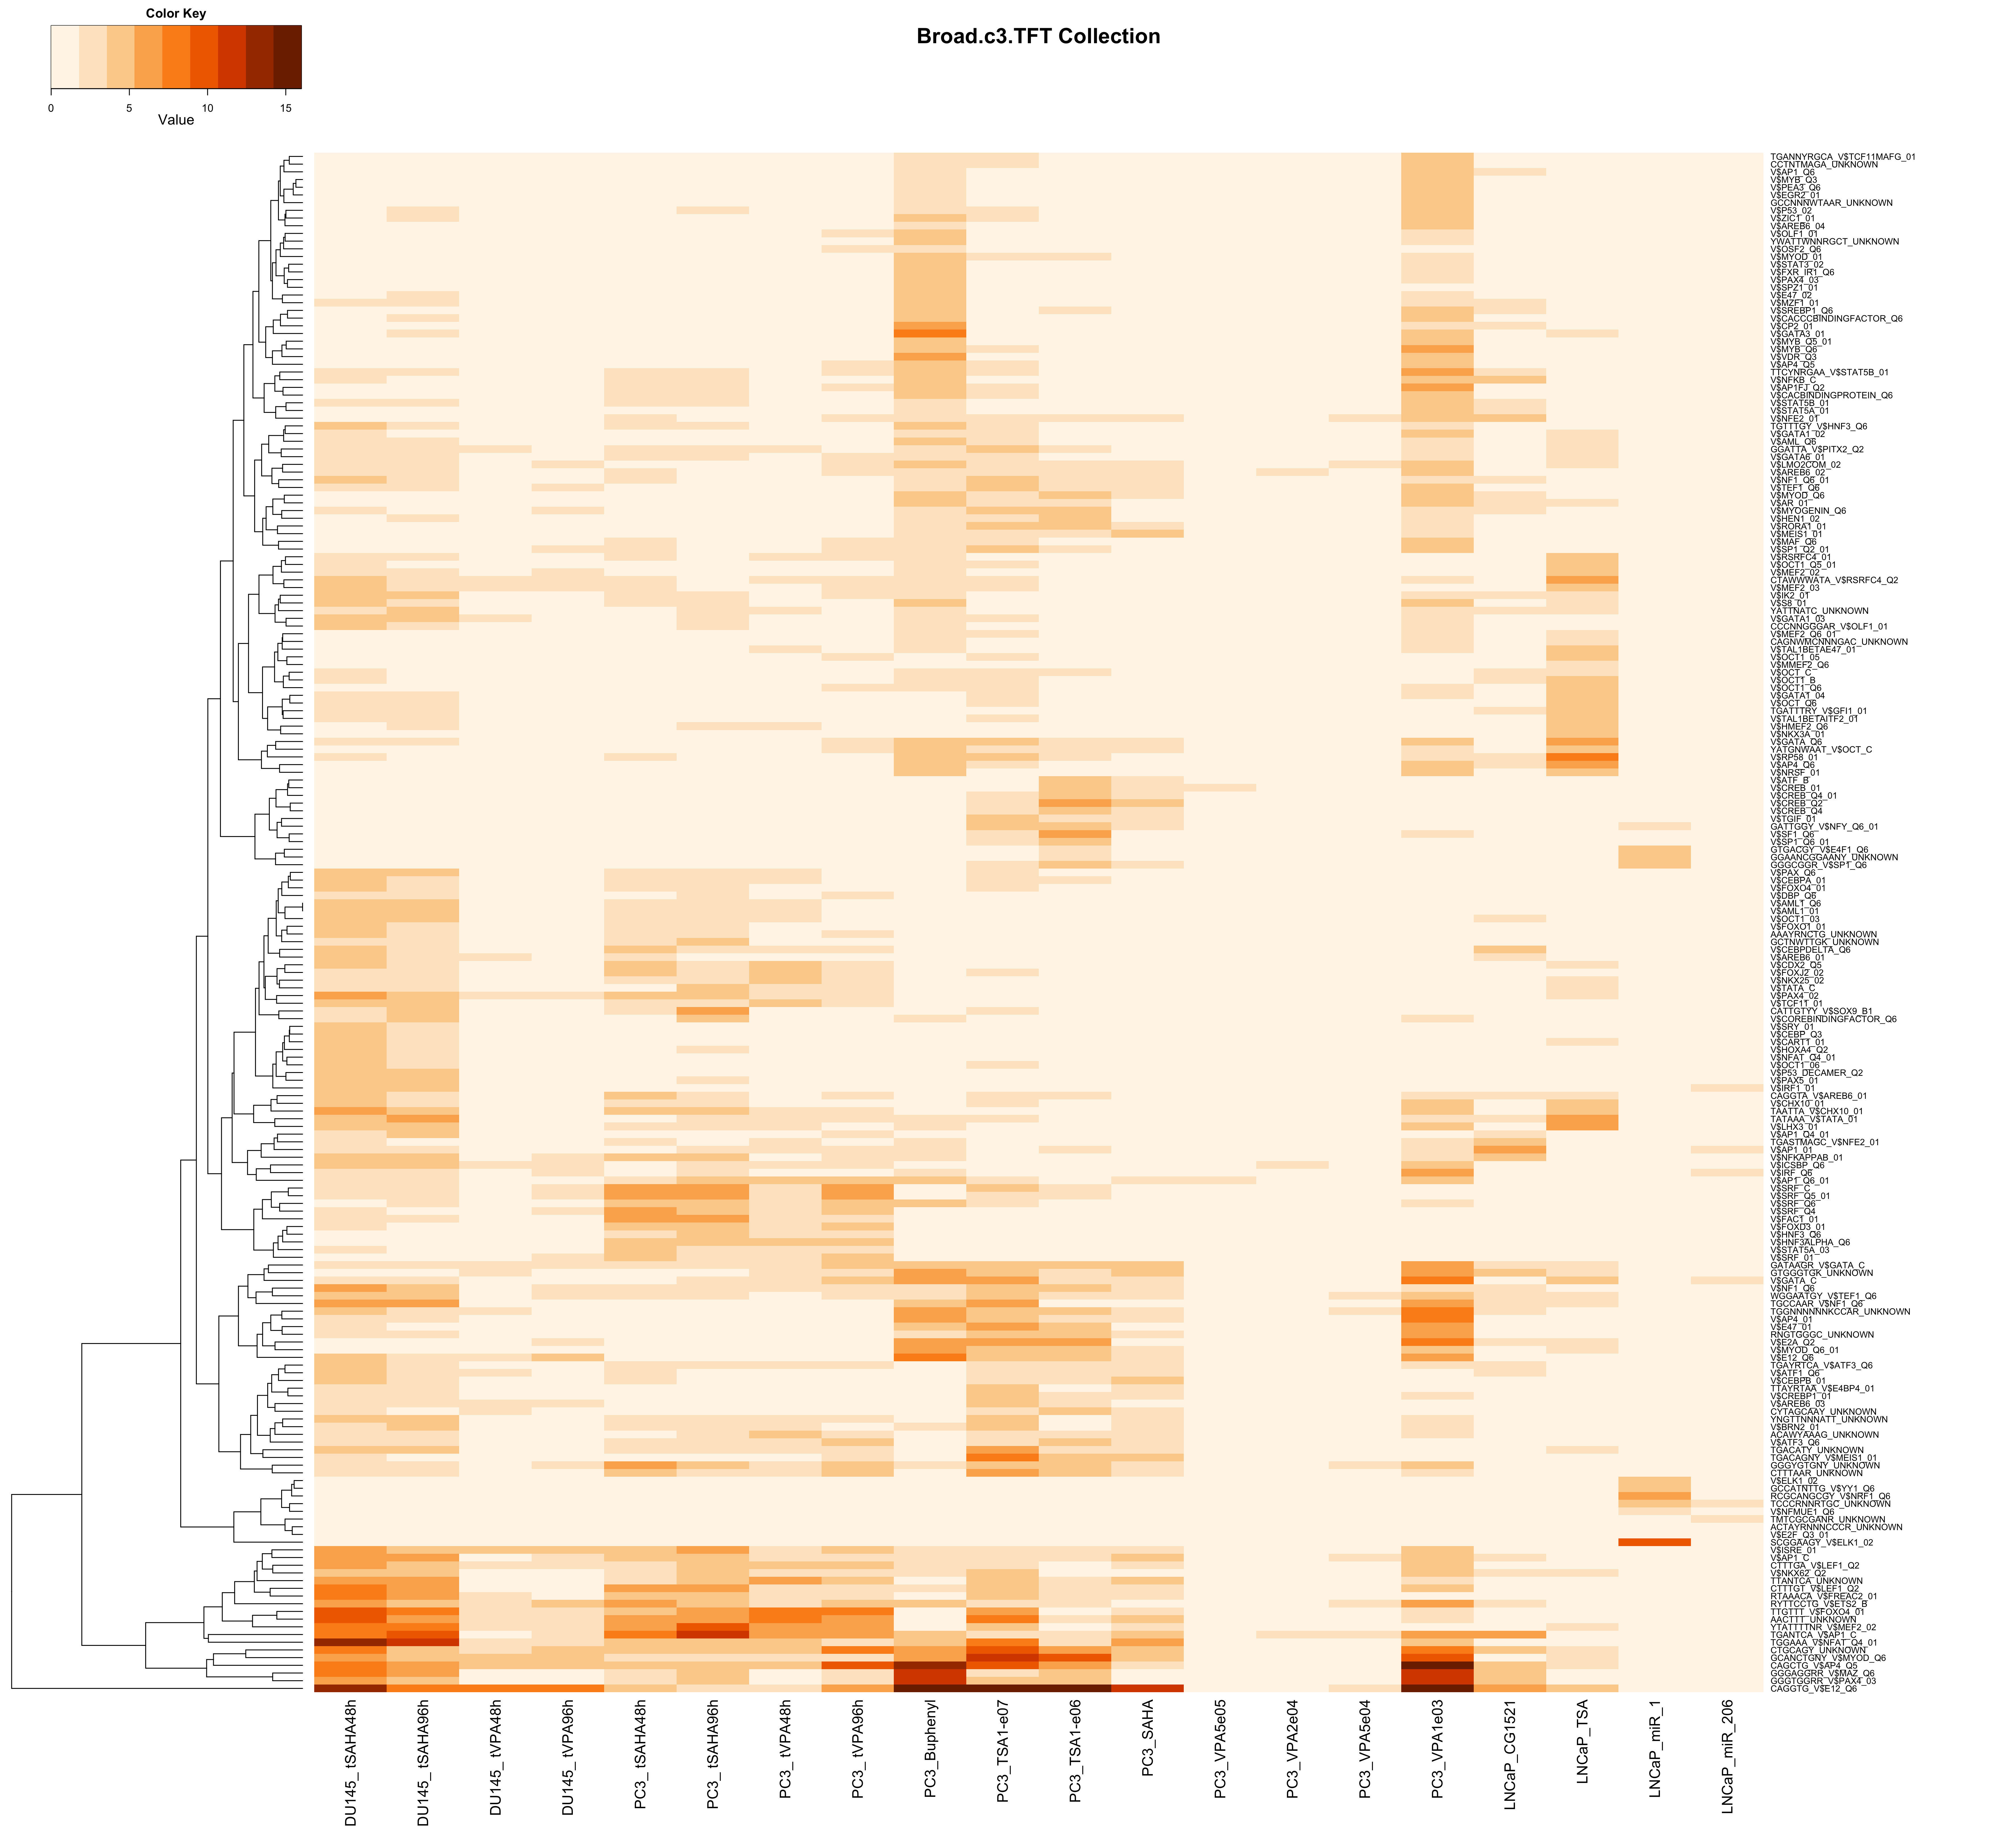
| upMax.Broad.c3.TFT | Analysis of Functional Annotation for up-regulation; heatmap of the top 200 FGS enriched in at least one contrast (FDR < 0.01); the color scale represents the number of decimal digits of the unadjusted p-values from the Wlcoxon rank-sum test; results for upMax.Broad.c3.TFT |
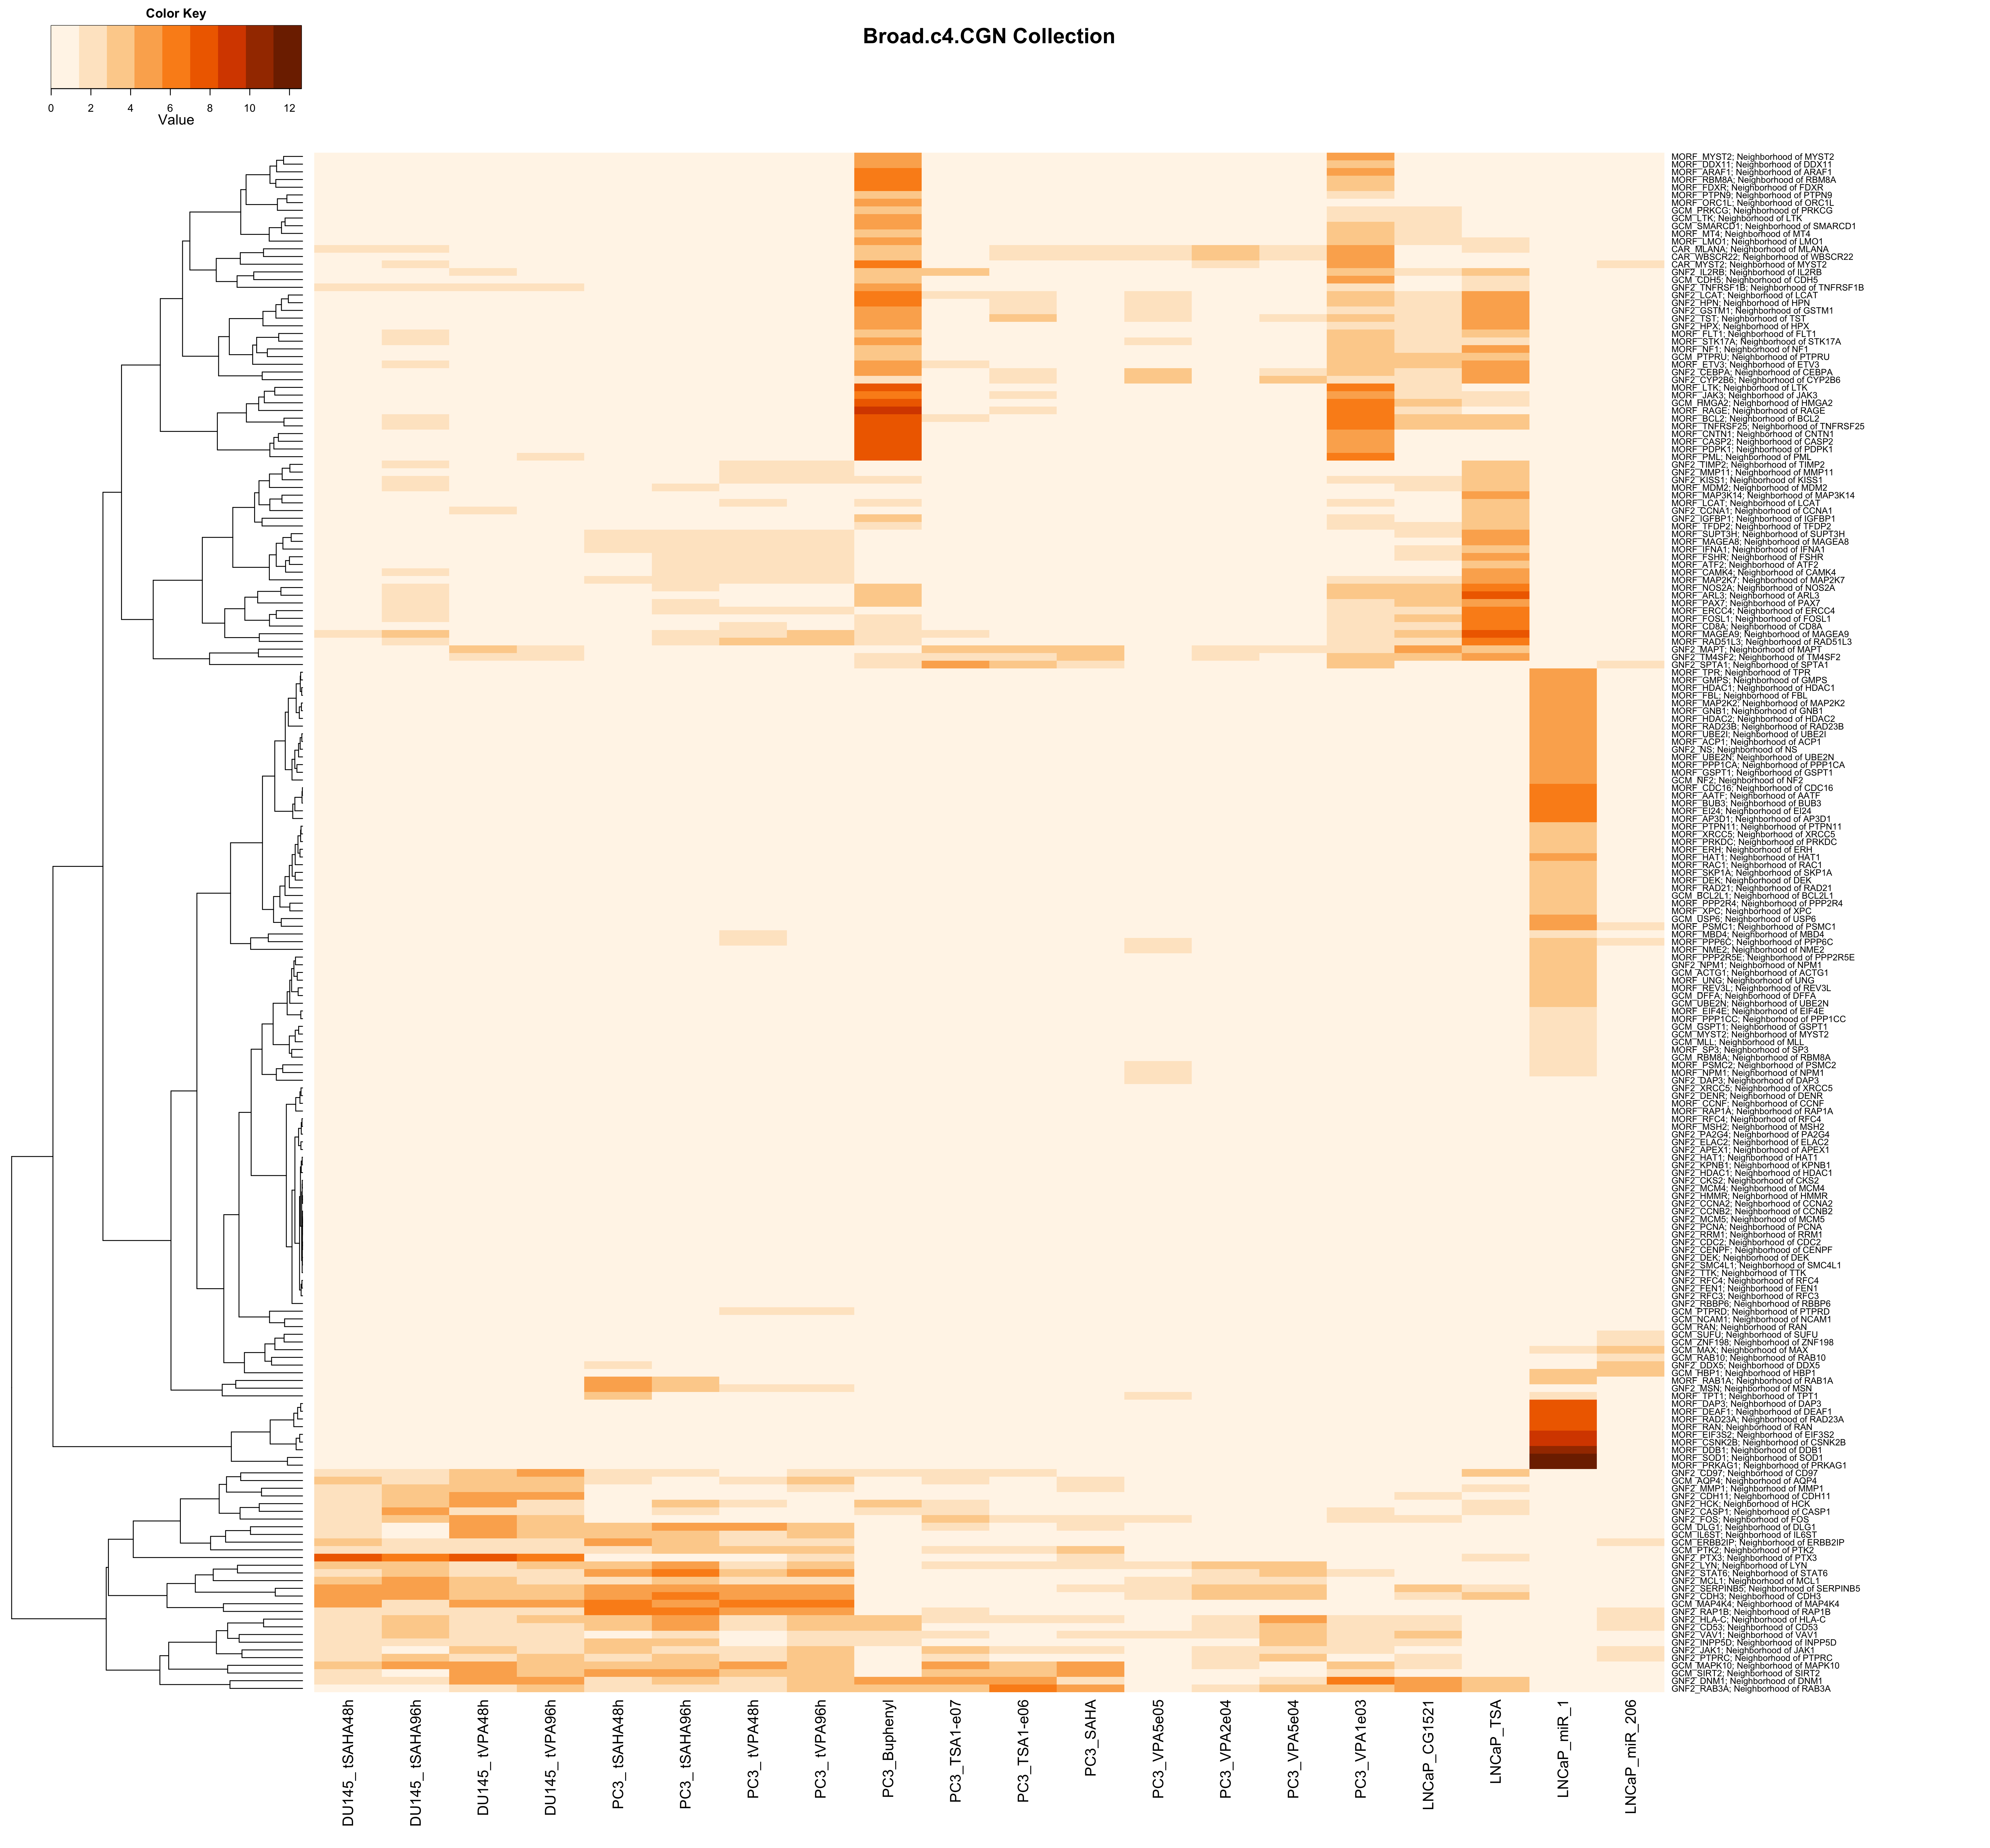
| upMax.Broad.c4.CGN | Analysis of Functional Annotation for up-regulation; heatmap of the top 200 FGS enriched in at least one contrast (FDR < 0.01); the color scale represents the number of decimal digits of the unadjusted p-values from the Wlcoxon rank-sum test; results for upMax.Broad.c4.CGN |
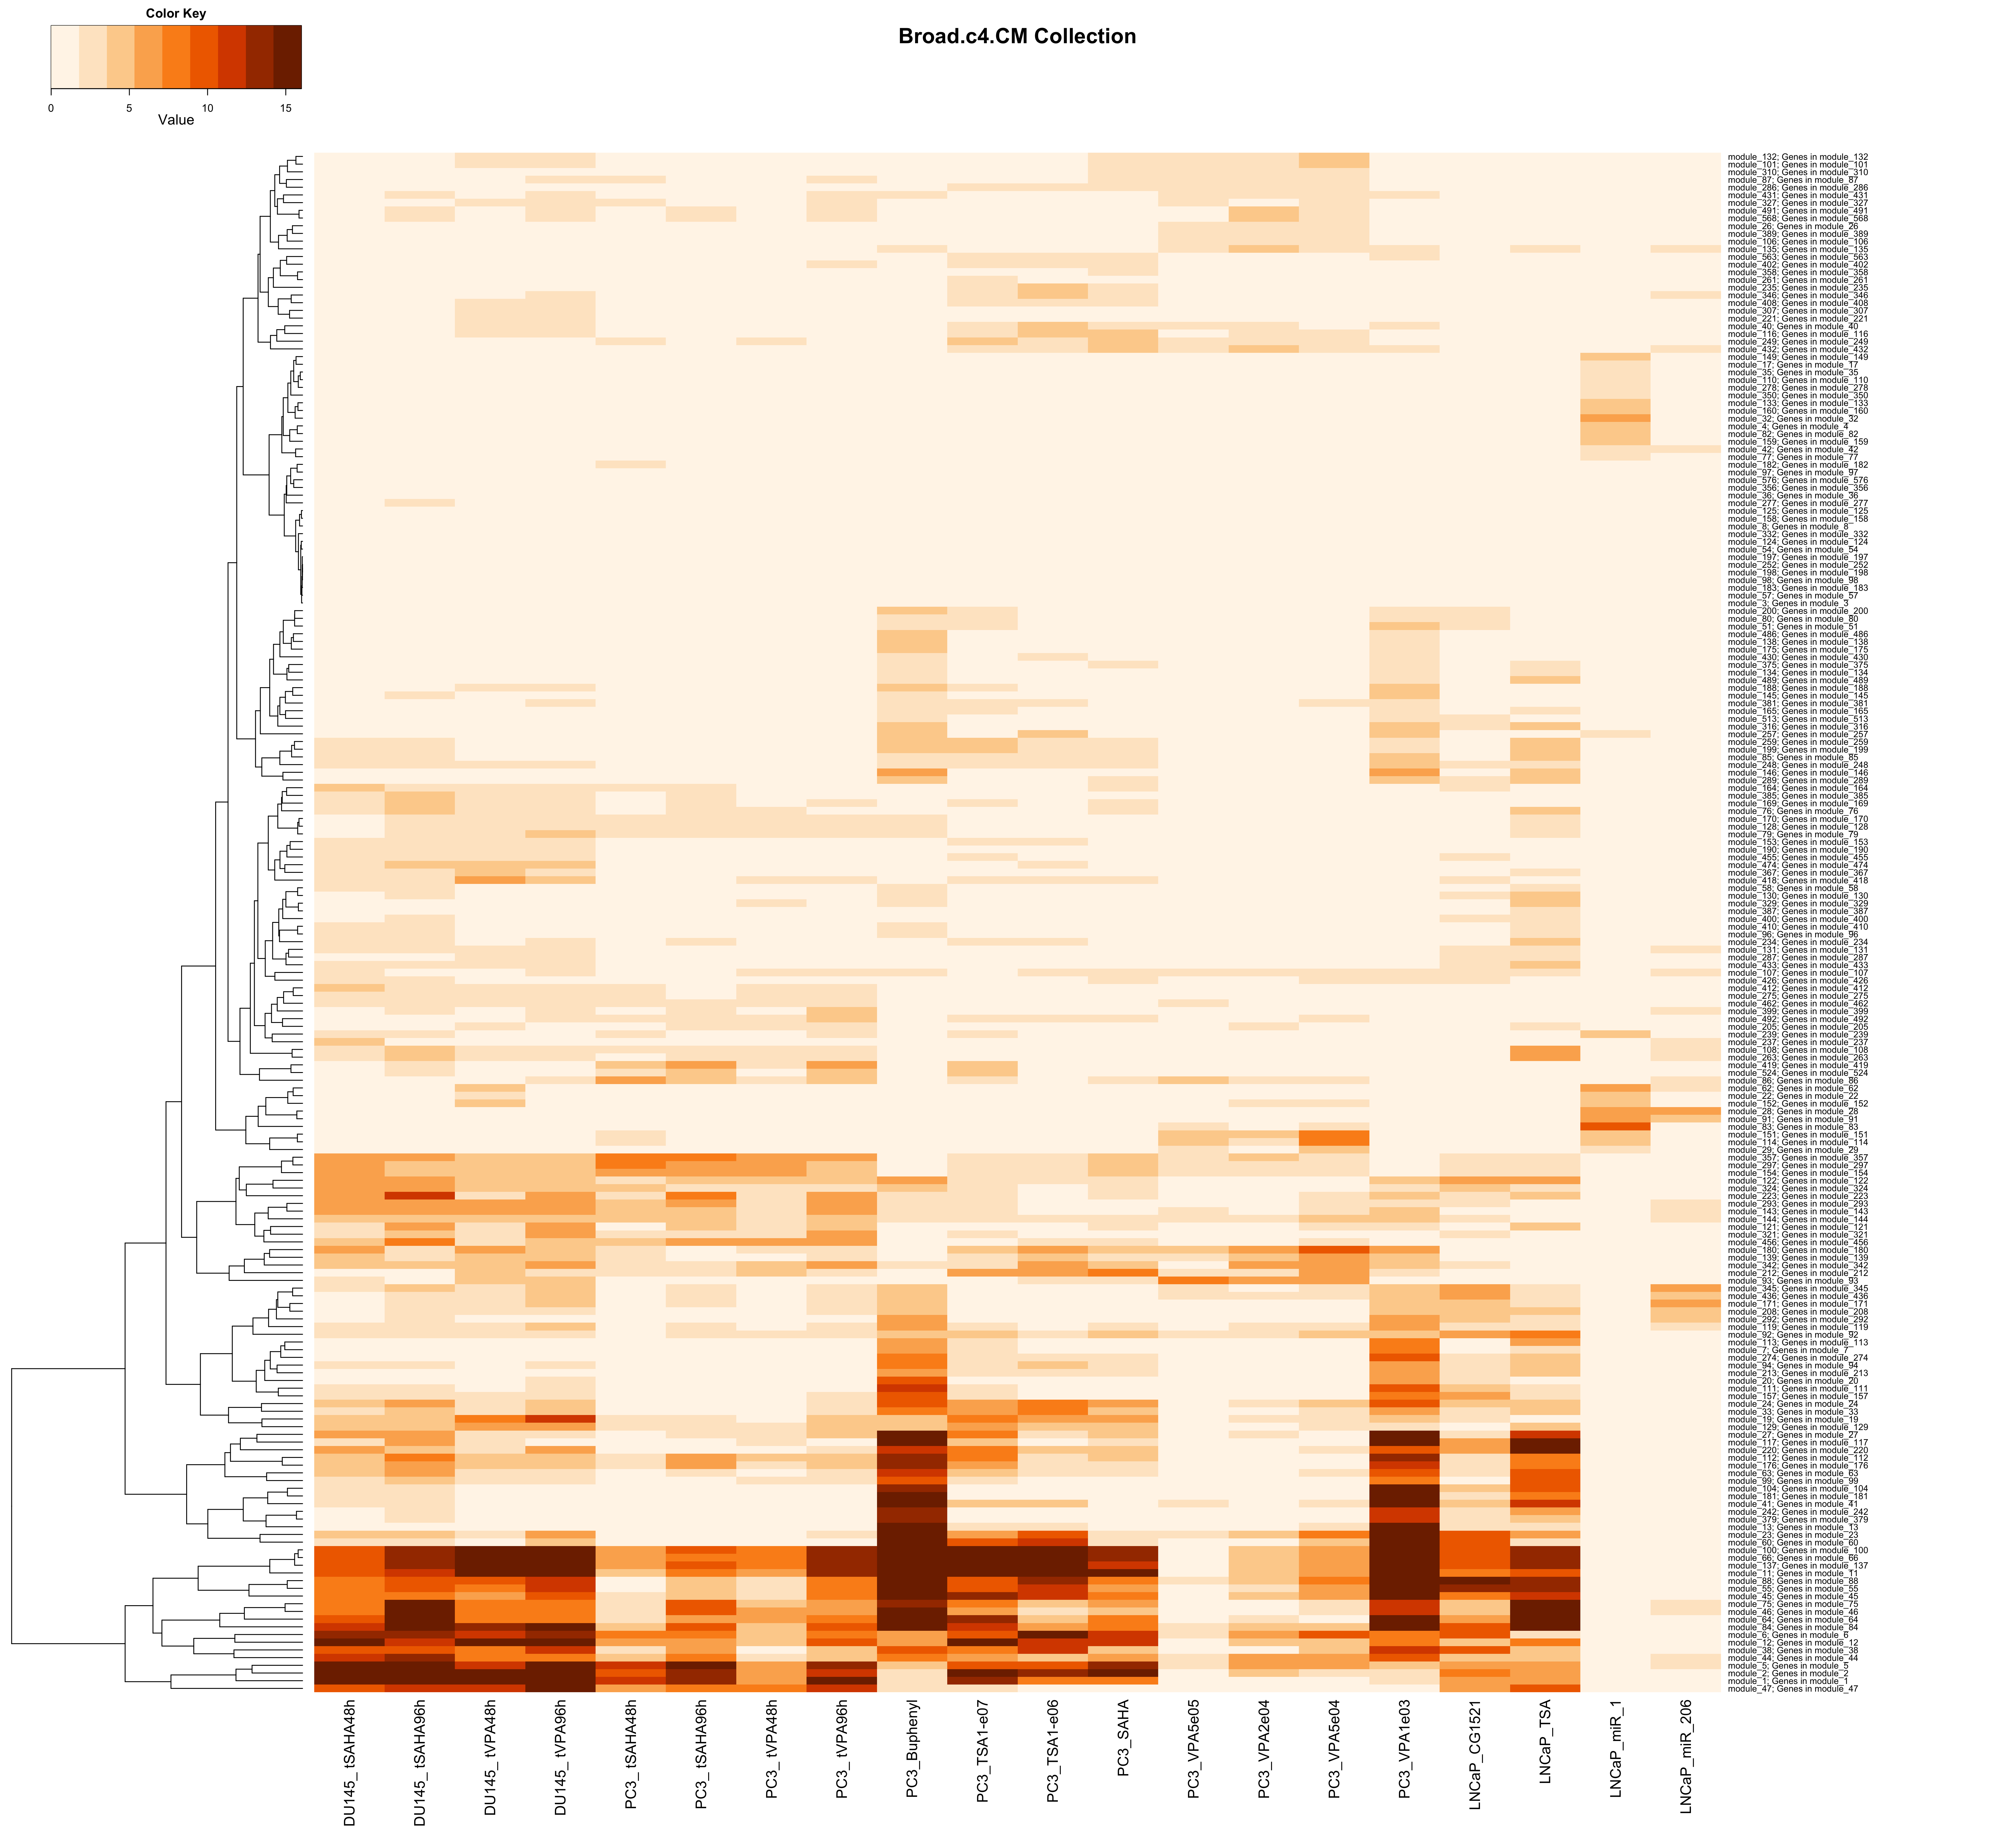
| upMax.Broad.c4.CM | Analysis of Functional Annotation for up-regulation; heatmap of the top 200 FGS enriched in at least one contrast (FDR < 0.01); the color scale represents the number of decimal digits of the unadjusted p-values from the Wlcoxon rank-sum test; results for upMax.Broad.c4.CM |
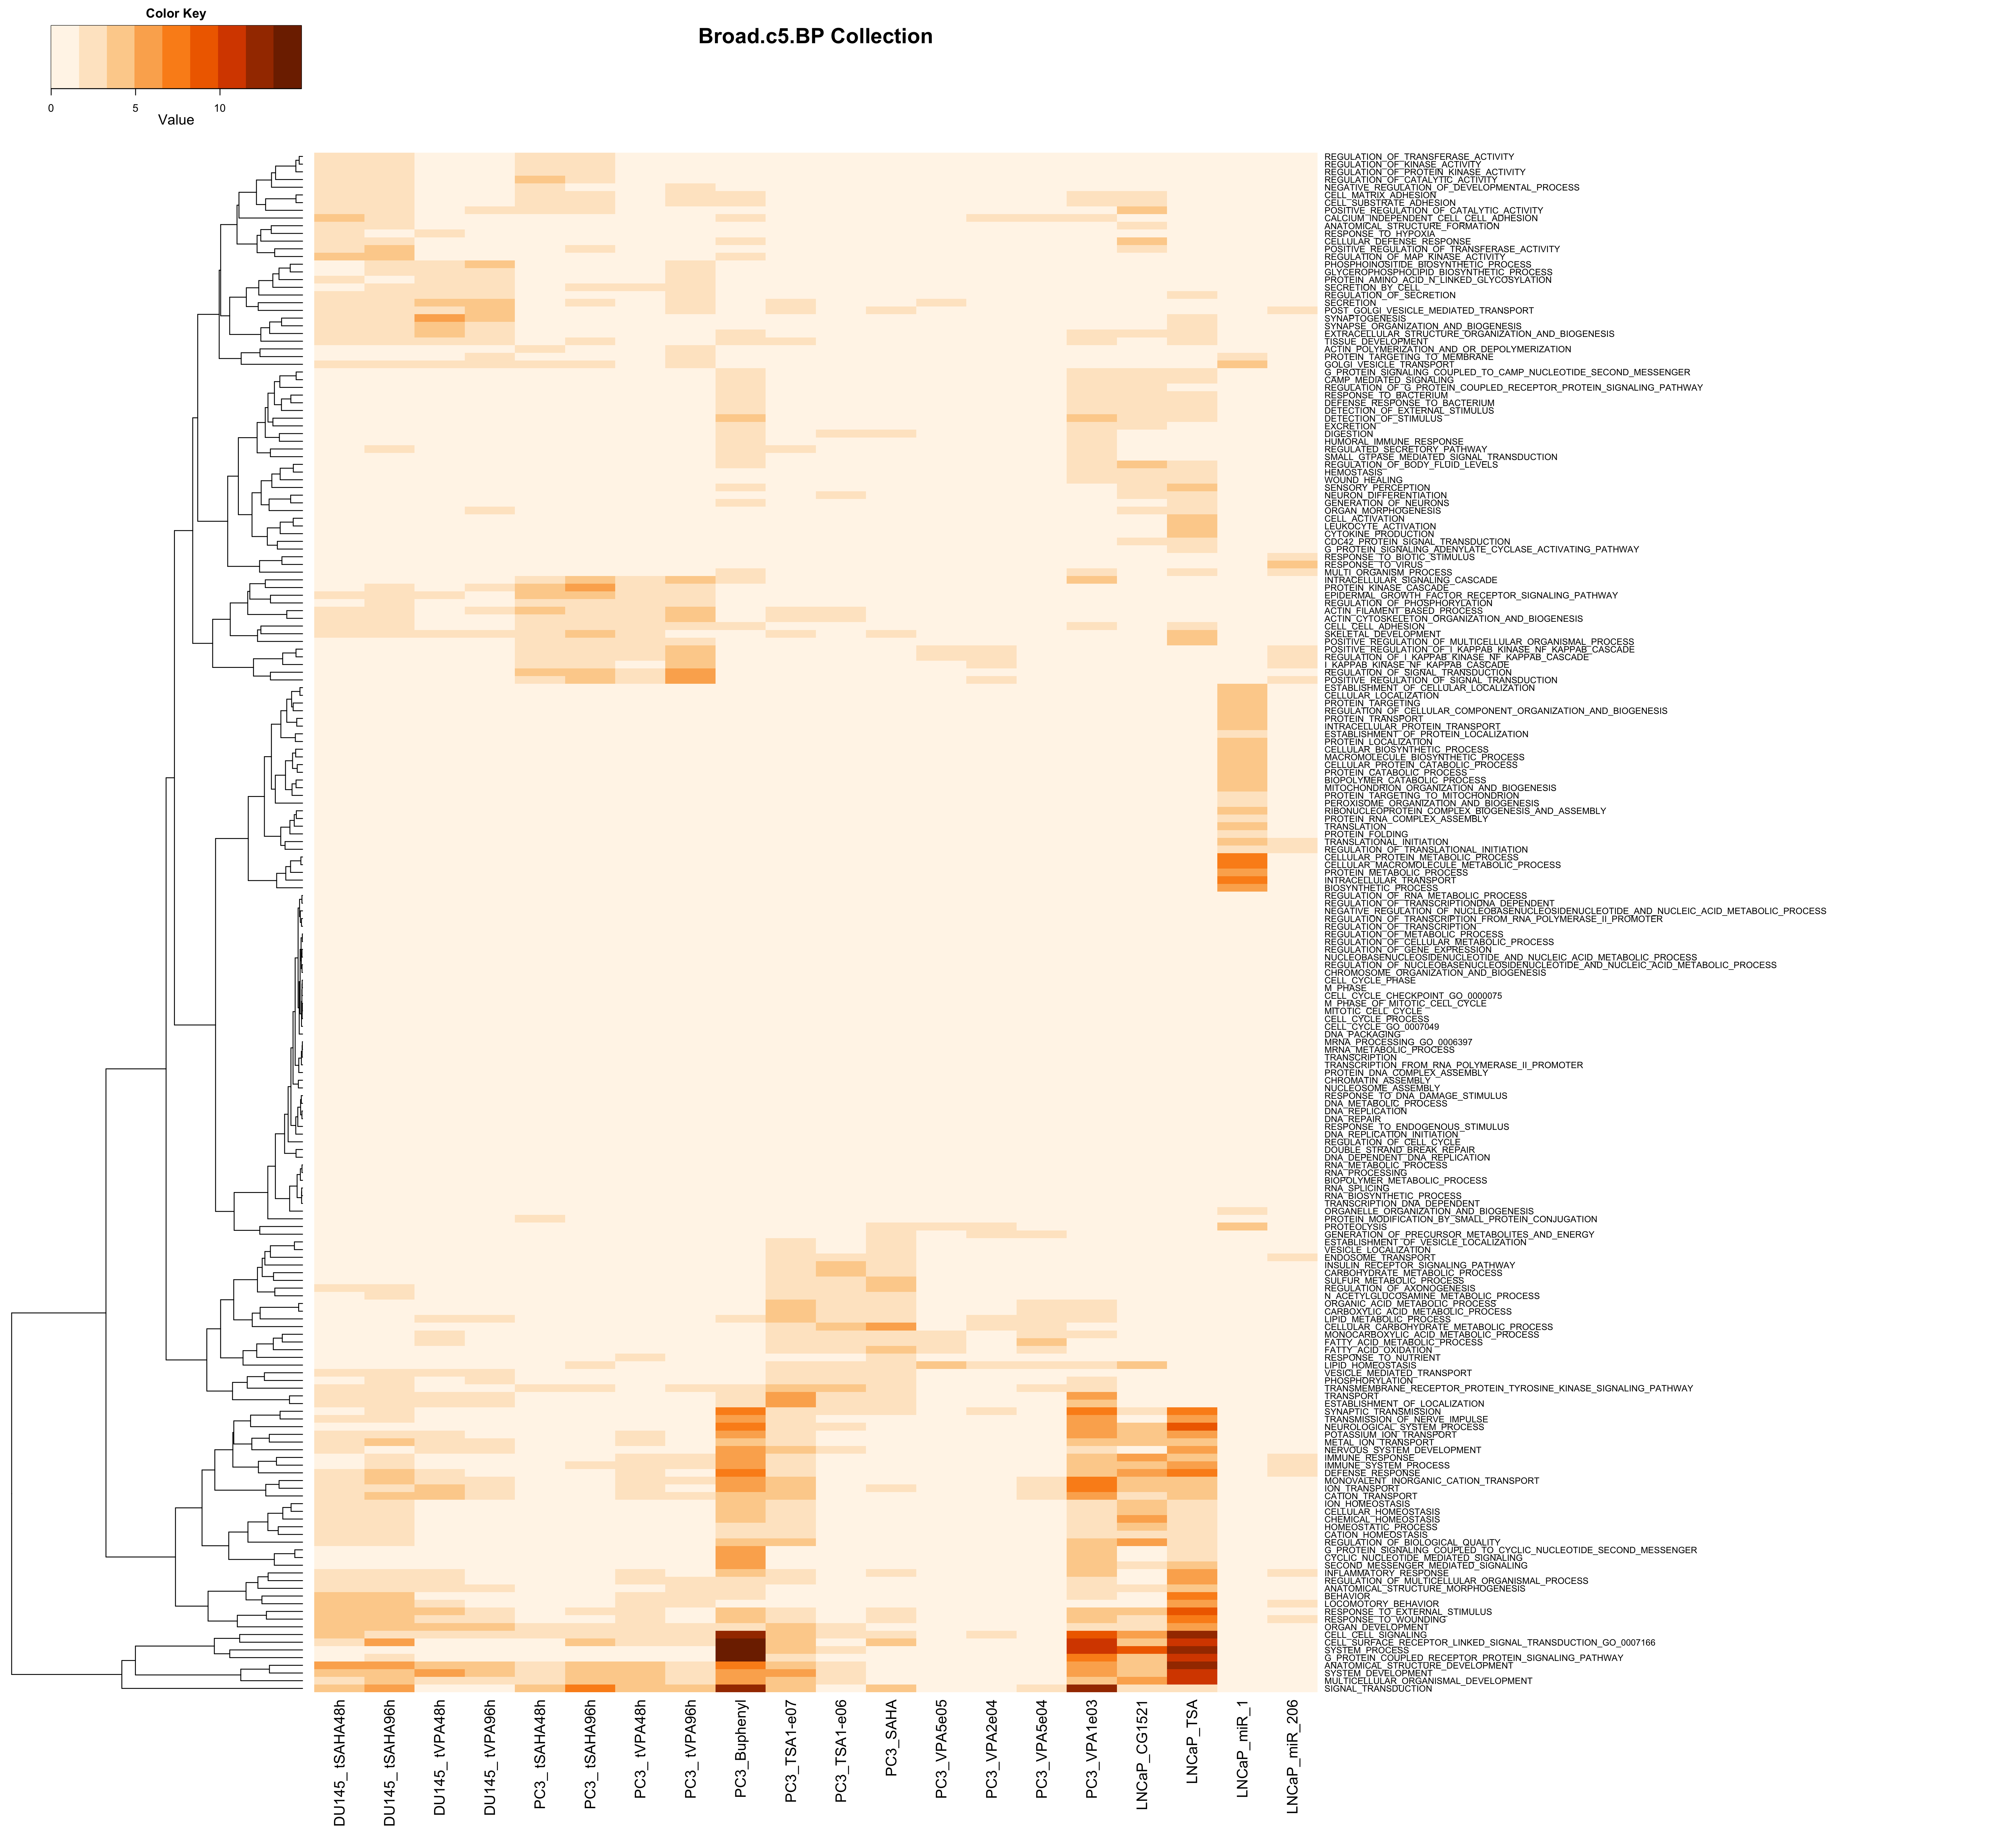
| upMax.Broad.c5.BP | Analysis of Functional Annotation for up-regulation; heatmap of the top 200 FGS enriched in at least one contrast (FDR < 0.01); the color scale represents the number of decimal digits of the unadjusted p-values from the Wlcoxon rank-sum test; results for upMax.Broad.c5.BP |
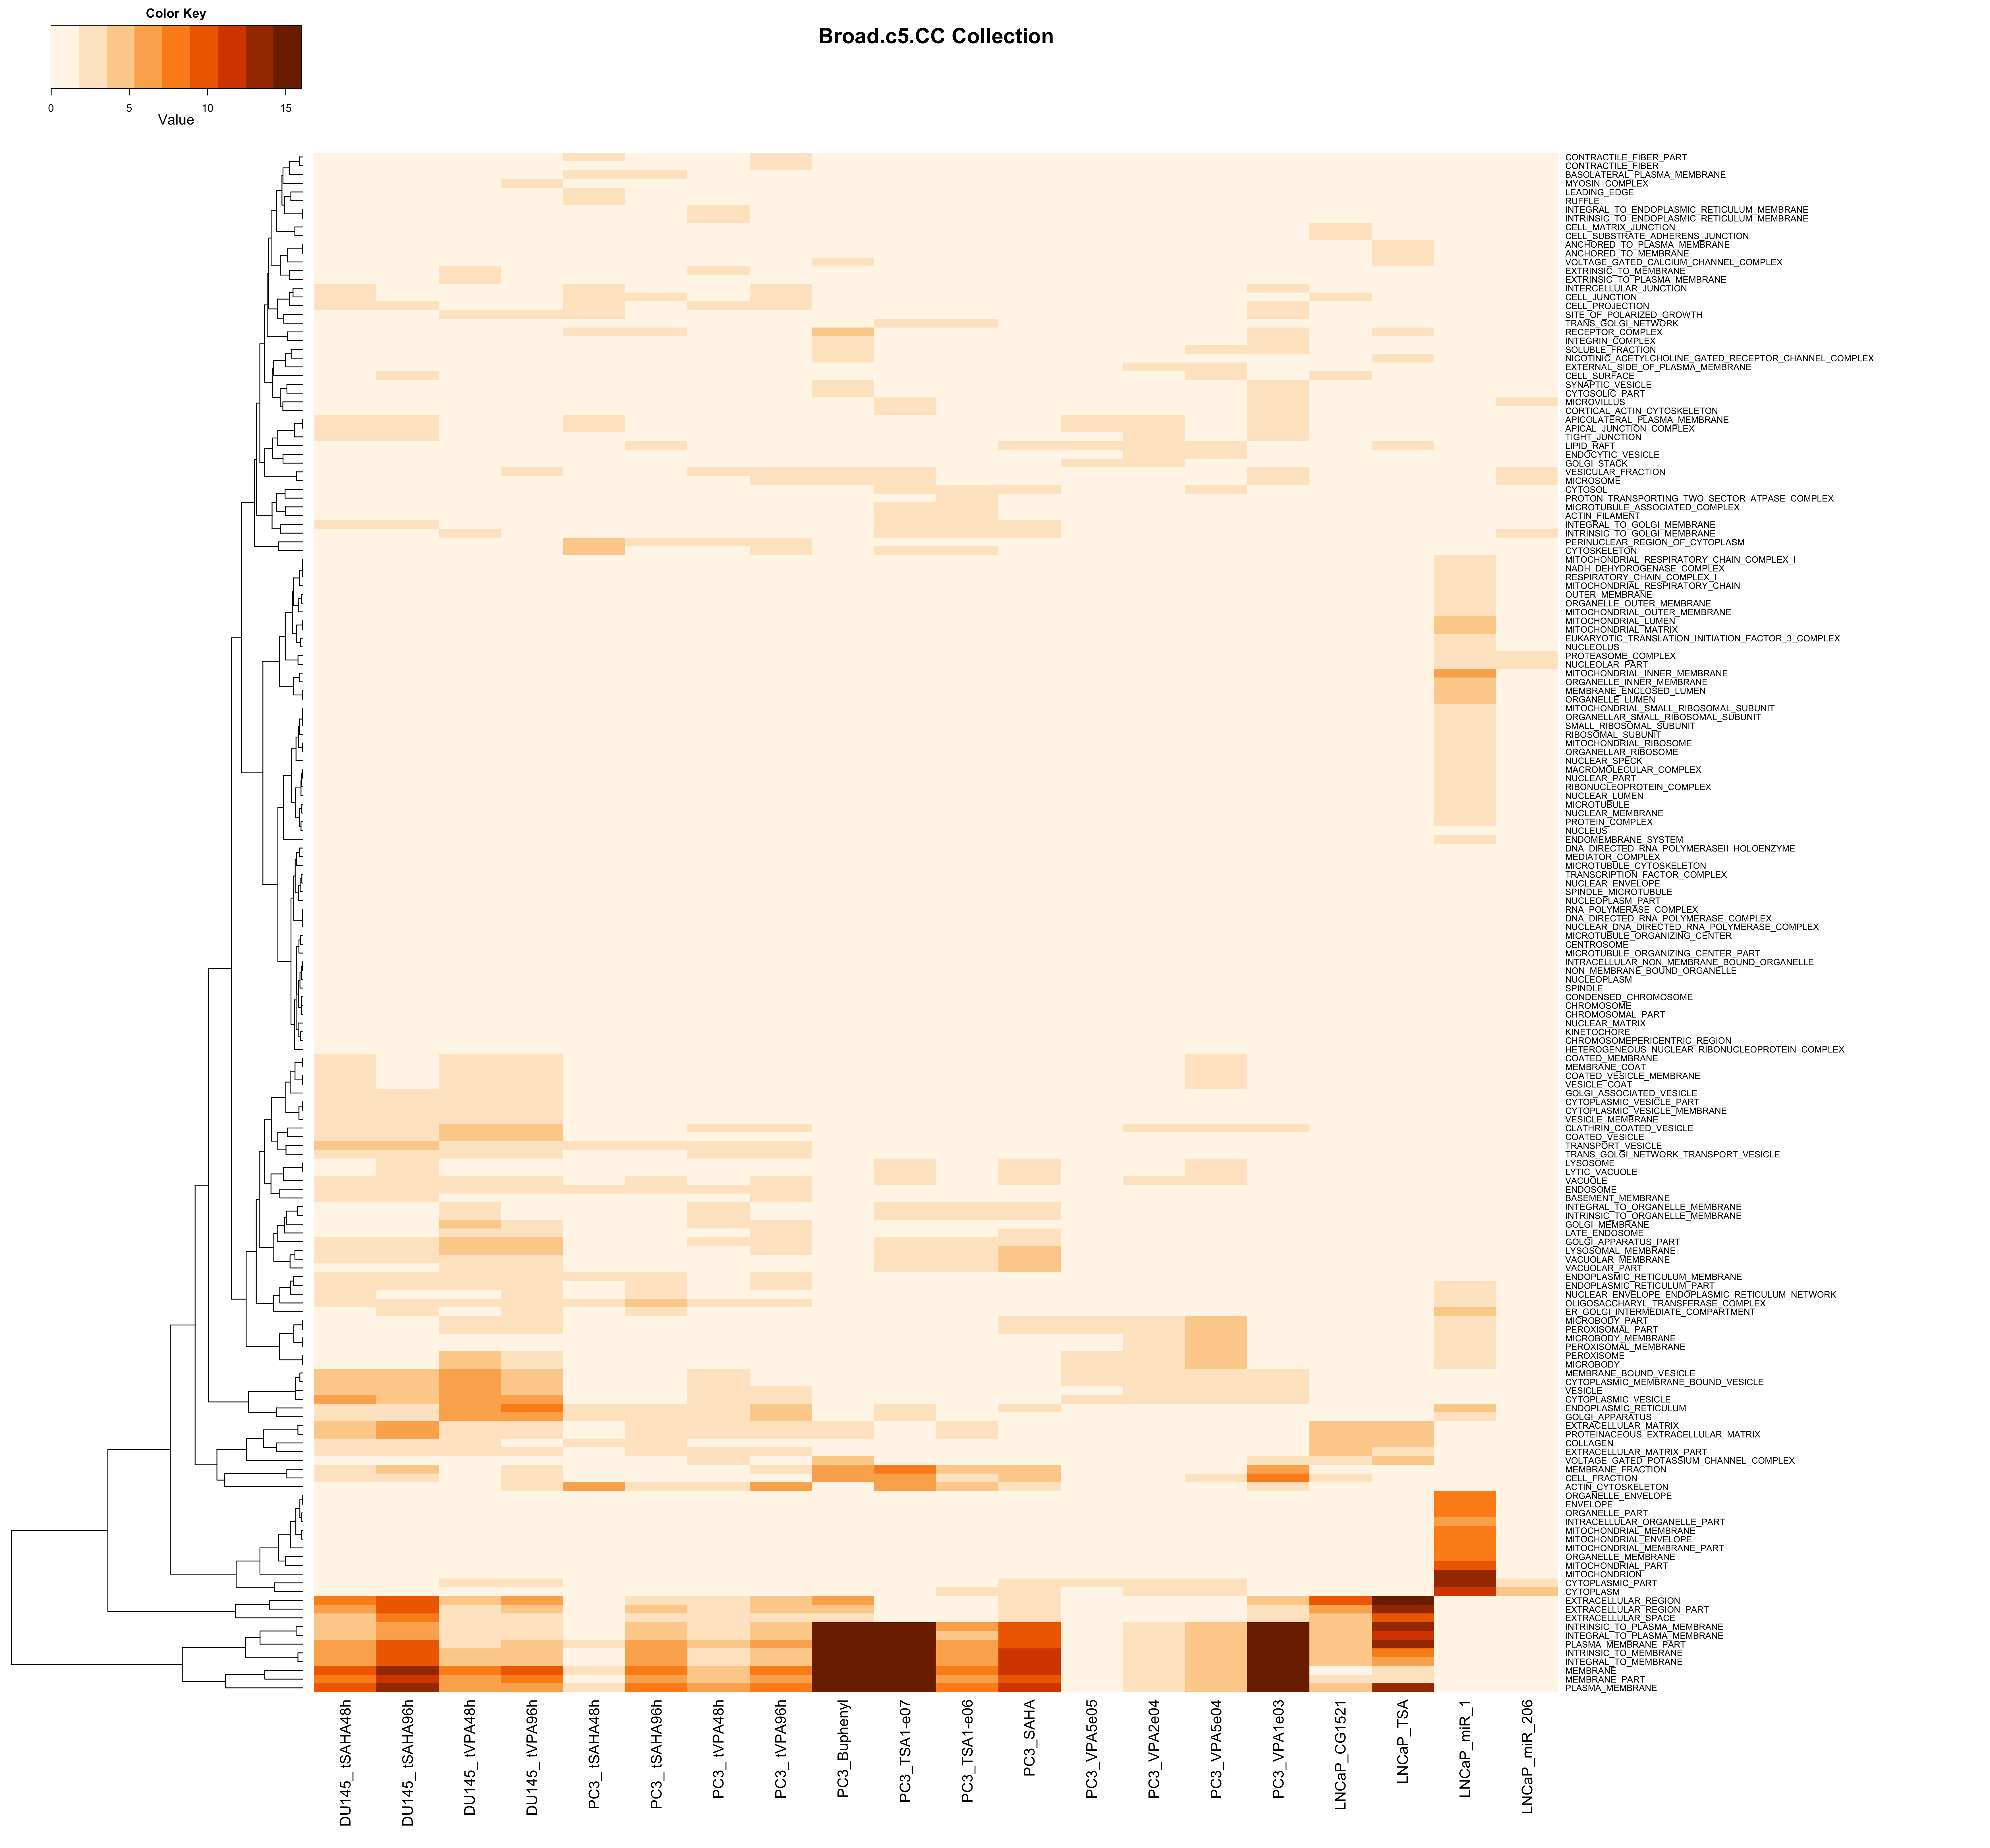
| upMax.Broad.c5.CC | Analysis of Functional Annotation for up-regulation; heatmap of the top 200 FGS enriched in at least one contrast (FDR < 0.01); the color scale represents the number of decimal digits of the unadjusted p-values from the Wlcoxon rank-sum test; results for upMax.Broad.c5.CC |
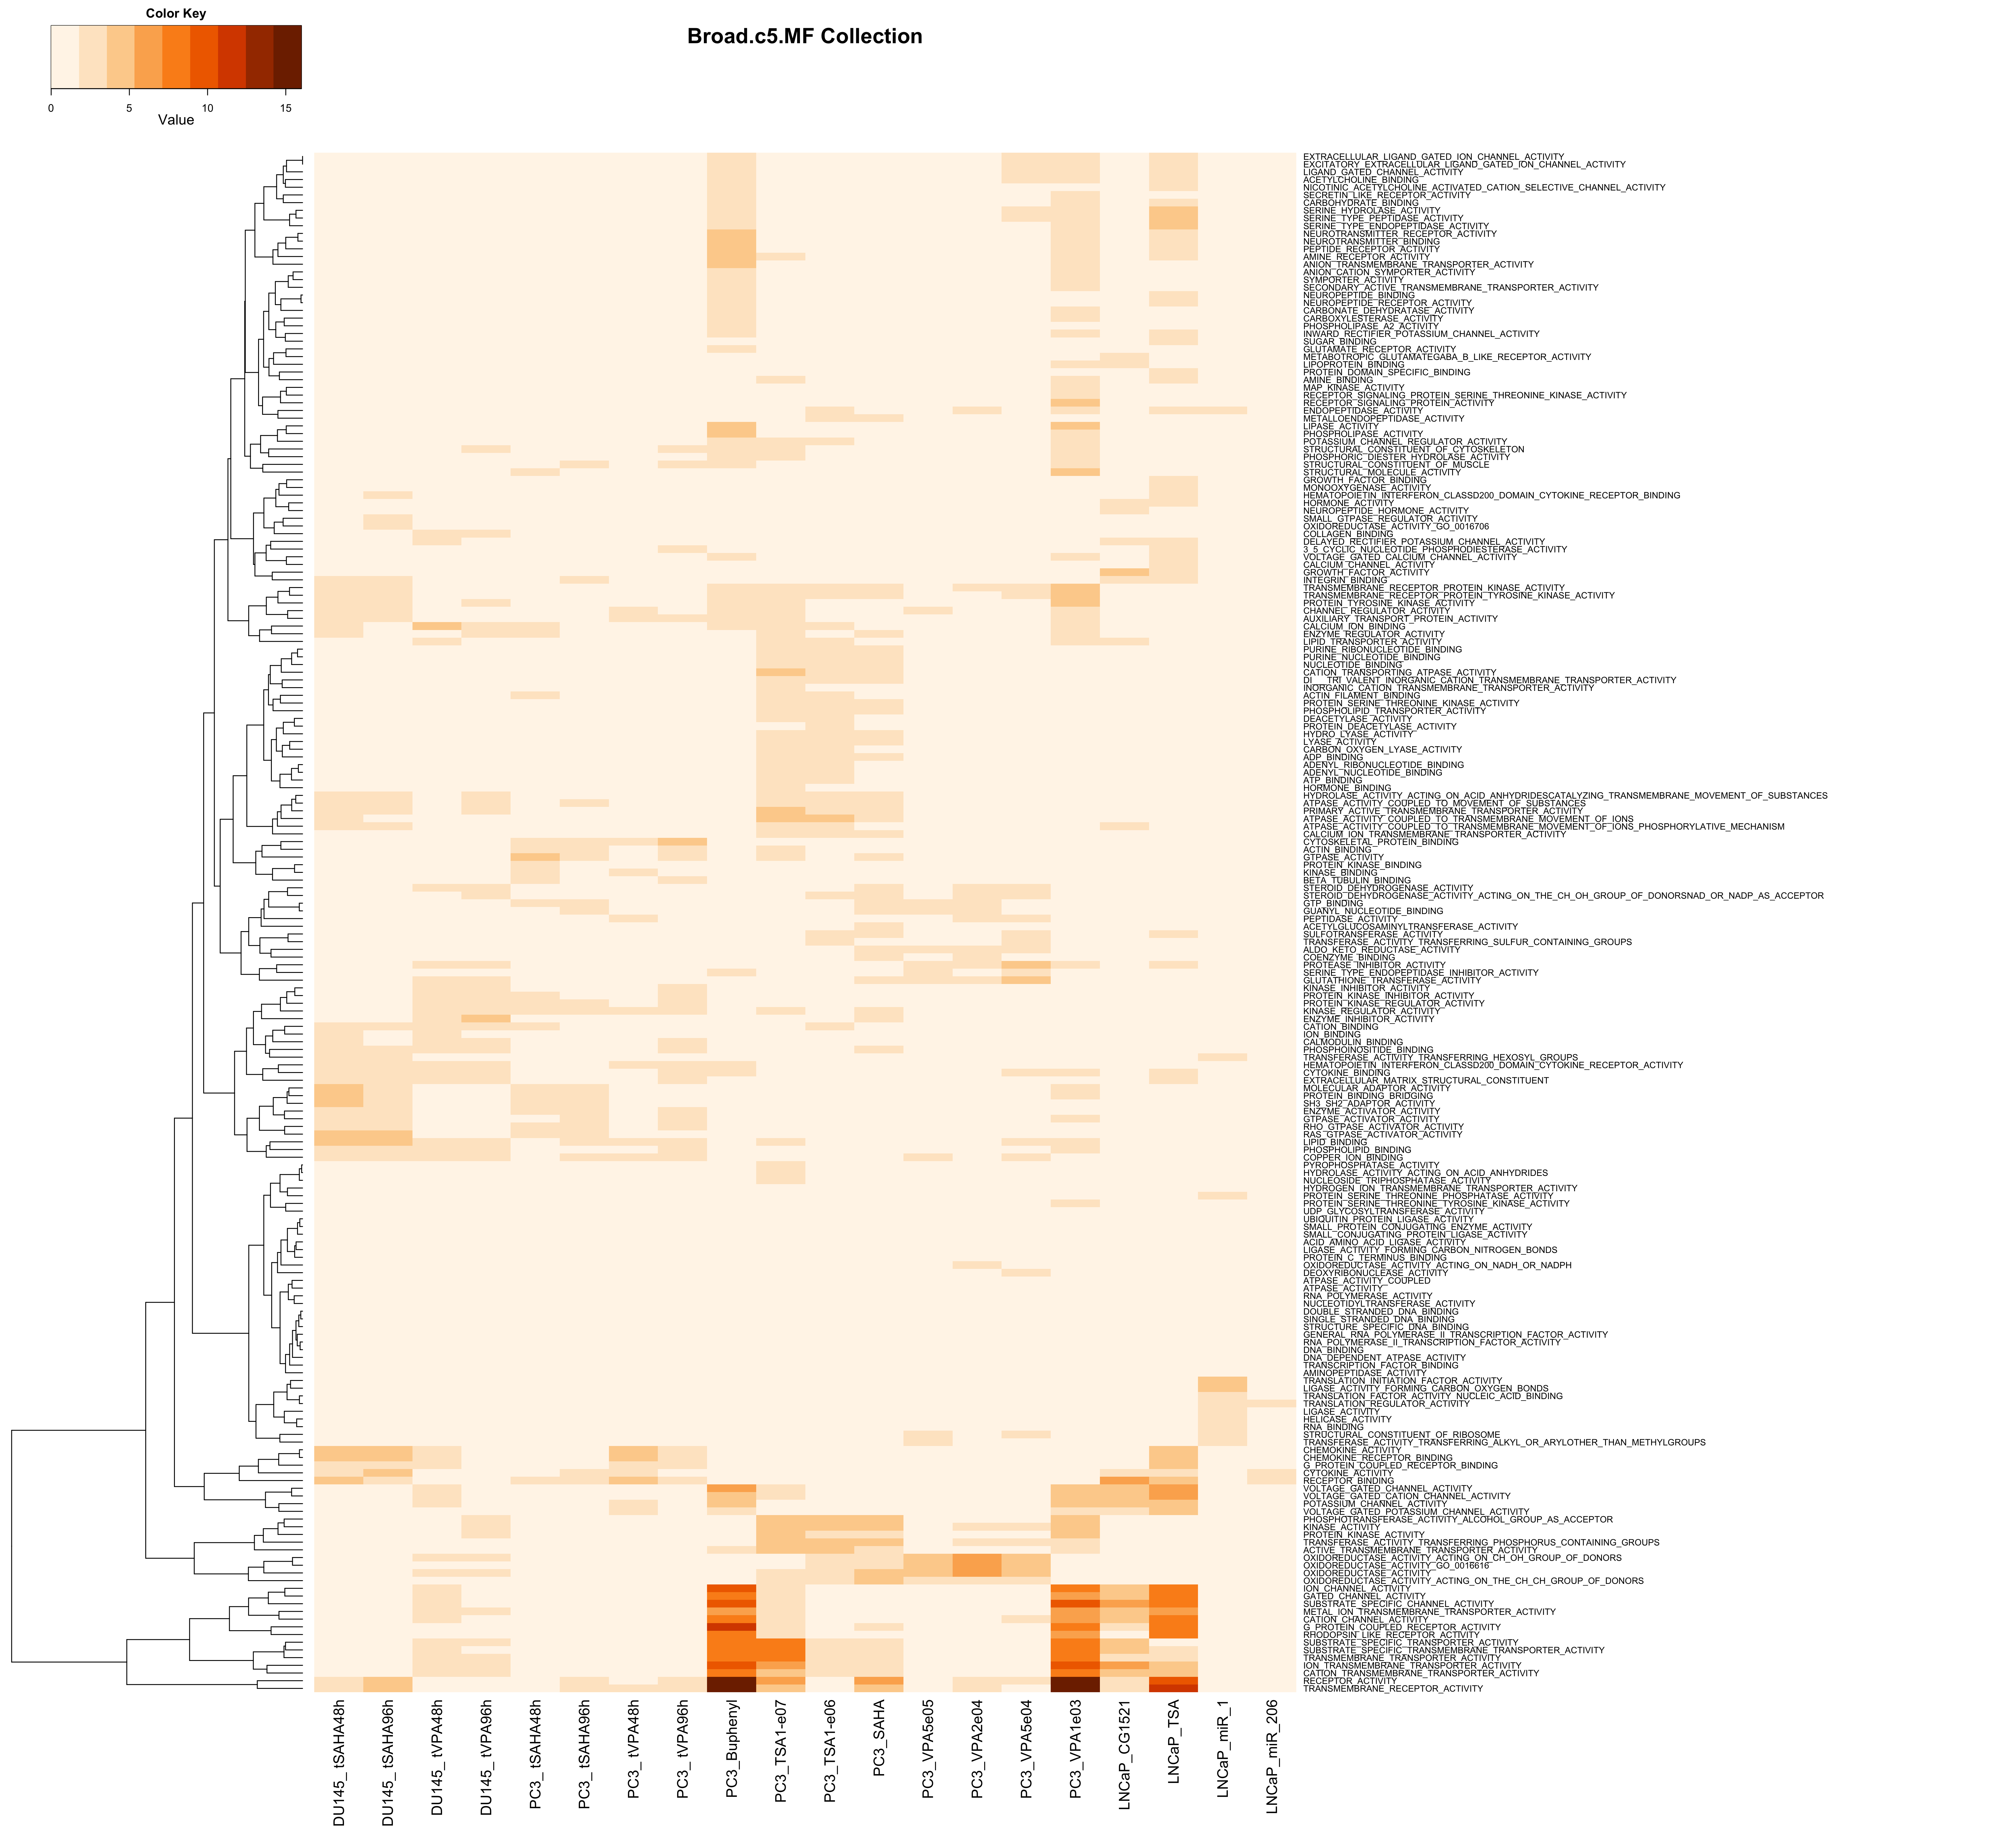
| upMax.Broad.c5.MF | Analysis of Functional Annotation for up-regulation; heatmap of the top 200 FGS enriched in at least one contrast (FDR < 0.01); the color scale represents the number of decimal digits of the unadjusted p-values from the Wlcoxon rank-sum test; results for upMax.Broad.c5.MF |
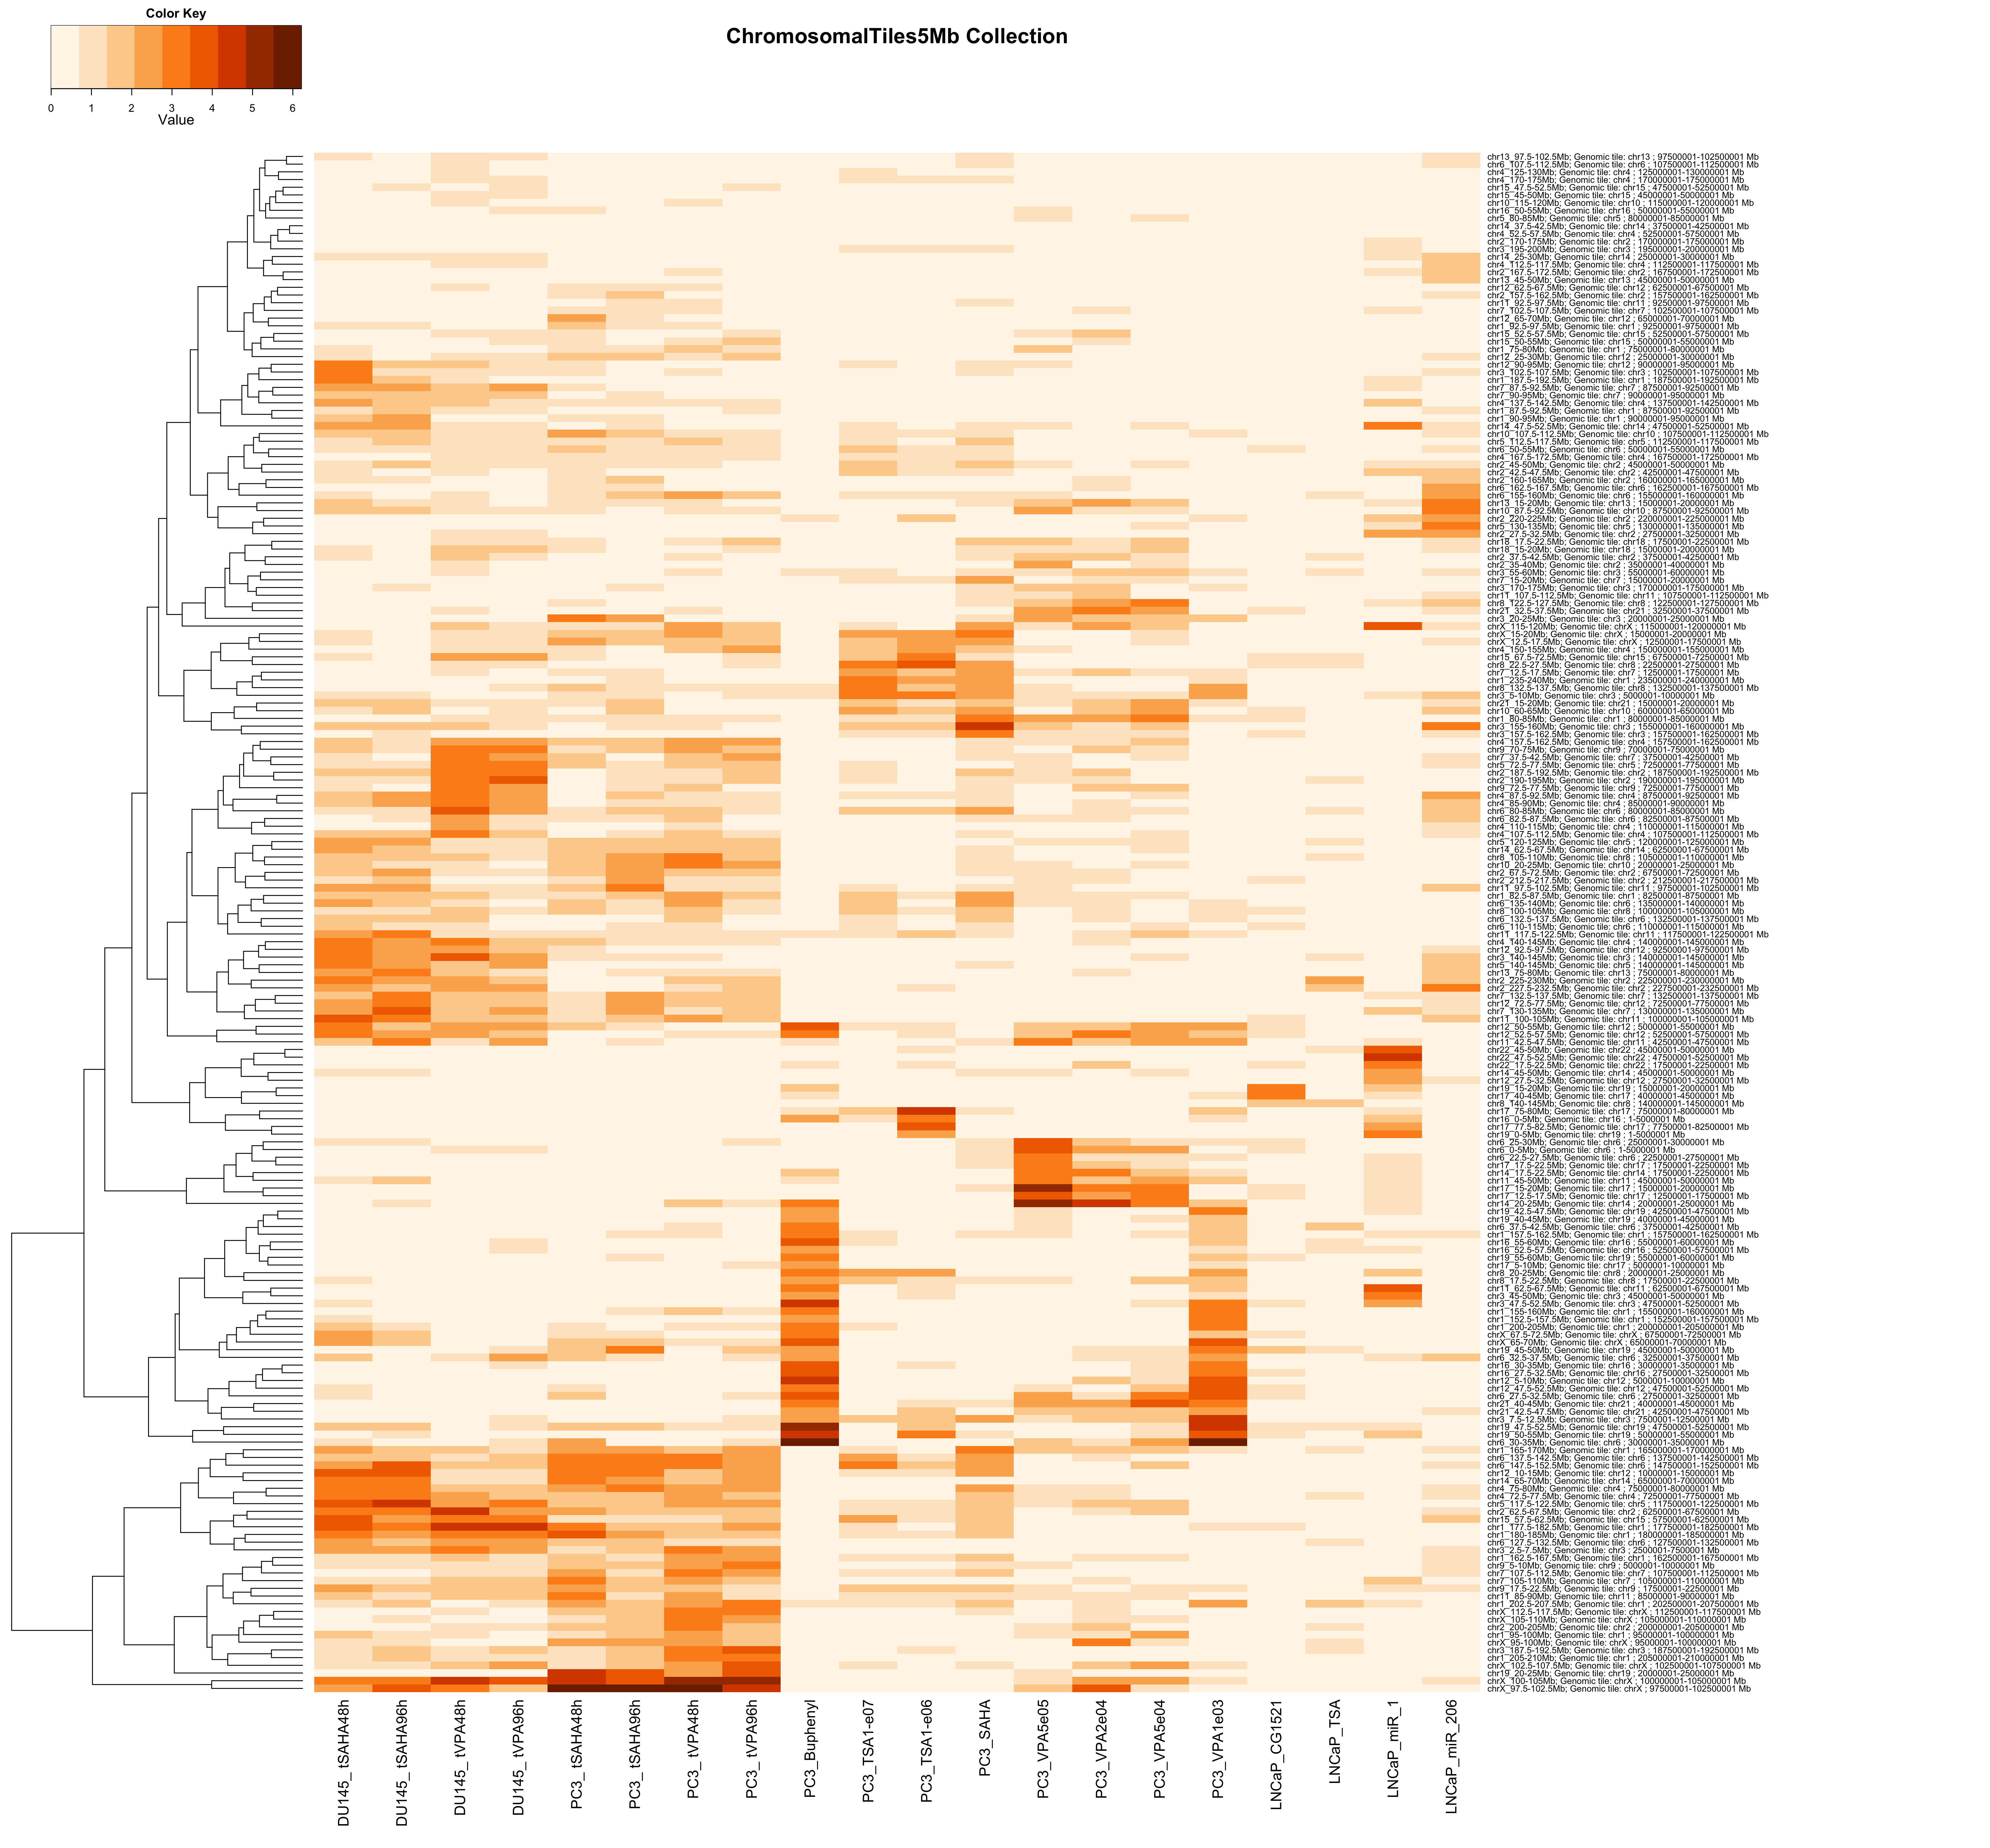
| upMax.ChromosomalTiles5Mb | Analysis of Functional Annotation for up-regulation; heatmap of the top 200 FGS enriched in at least one contrast (FDR < 0.01); the color scale represents the number of decimal digits of the unadjusted p-values from the Wlcoxon rank-sum test; results for upMax.ChromosomalTiles5Mb |
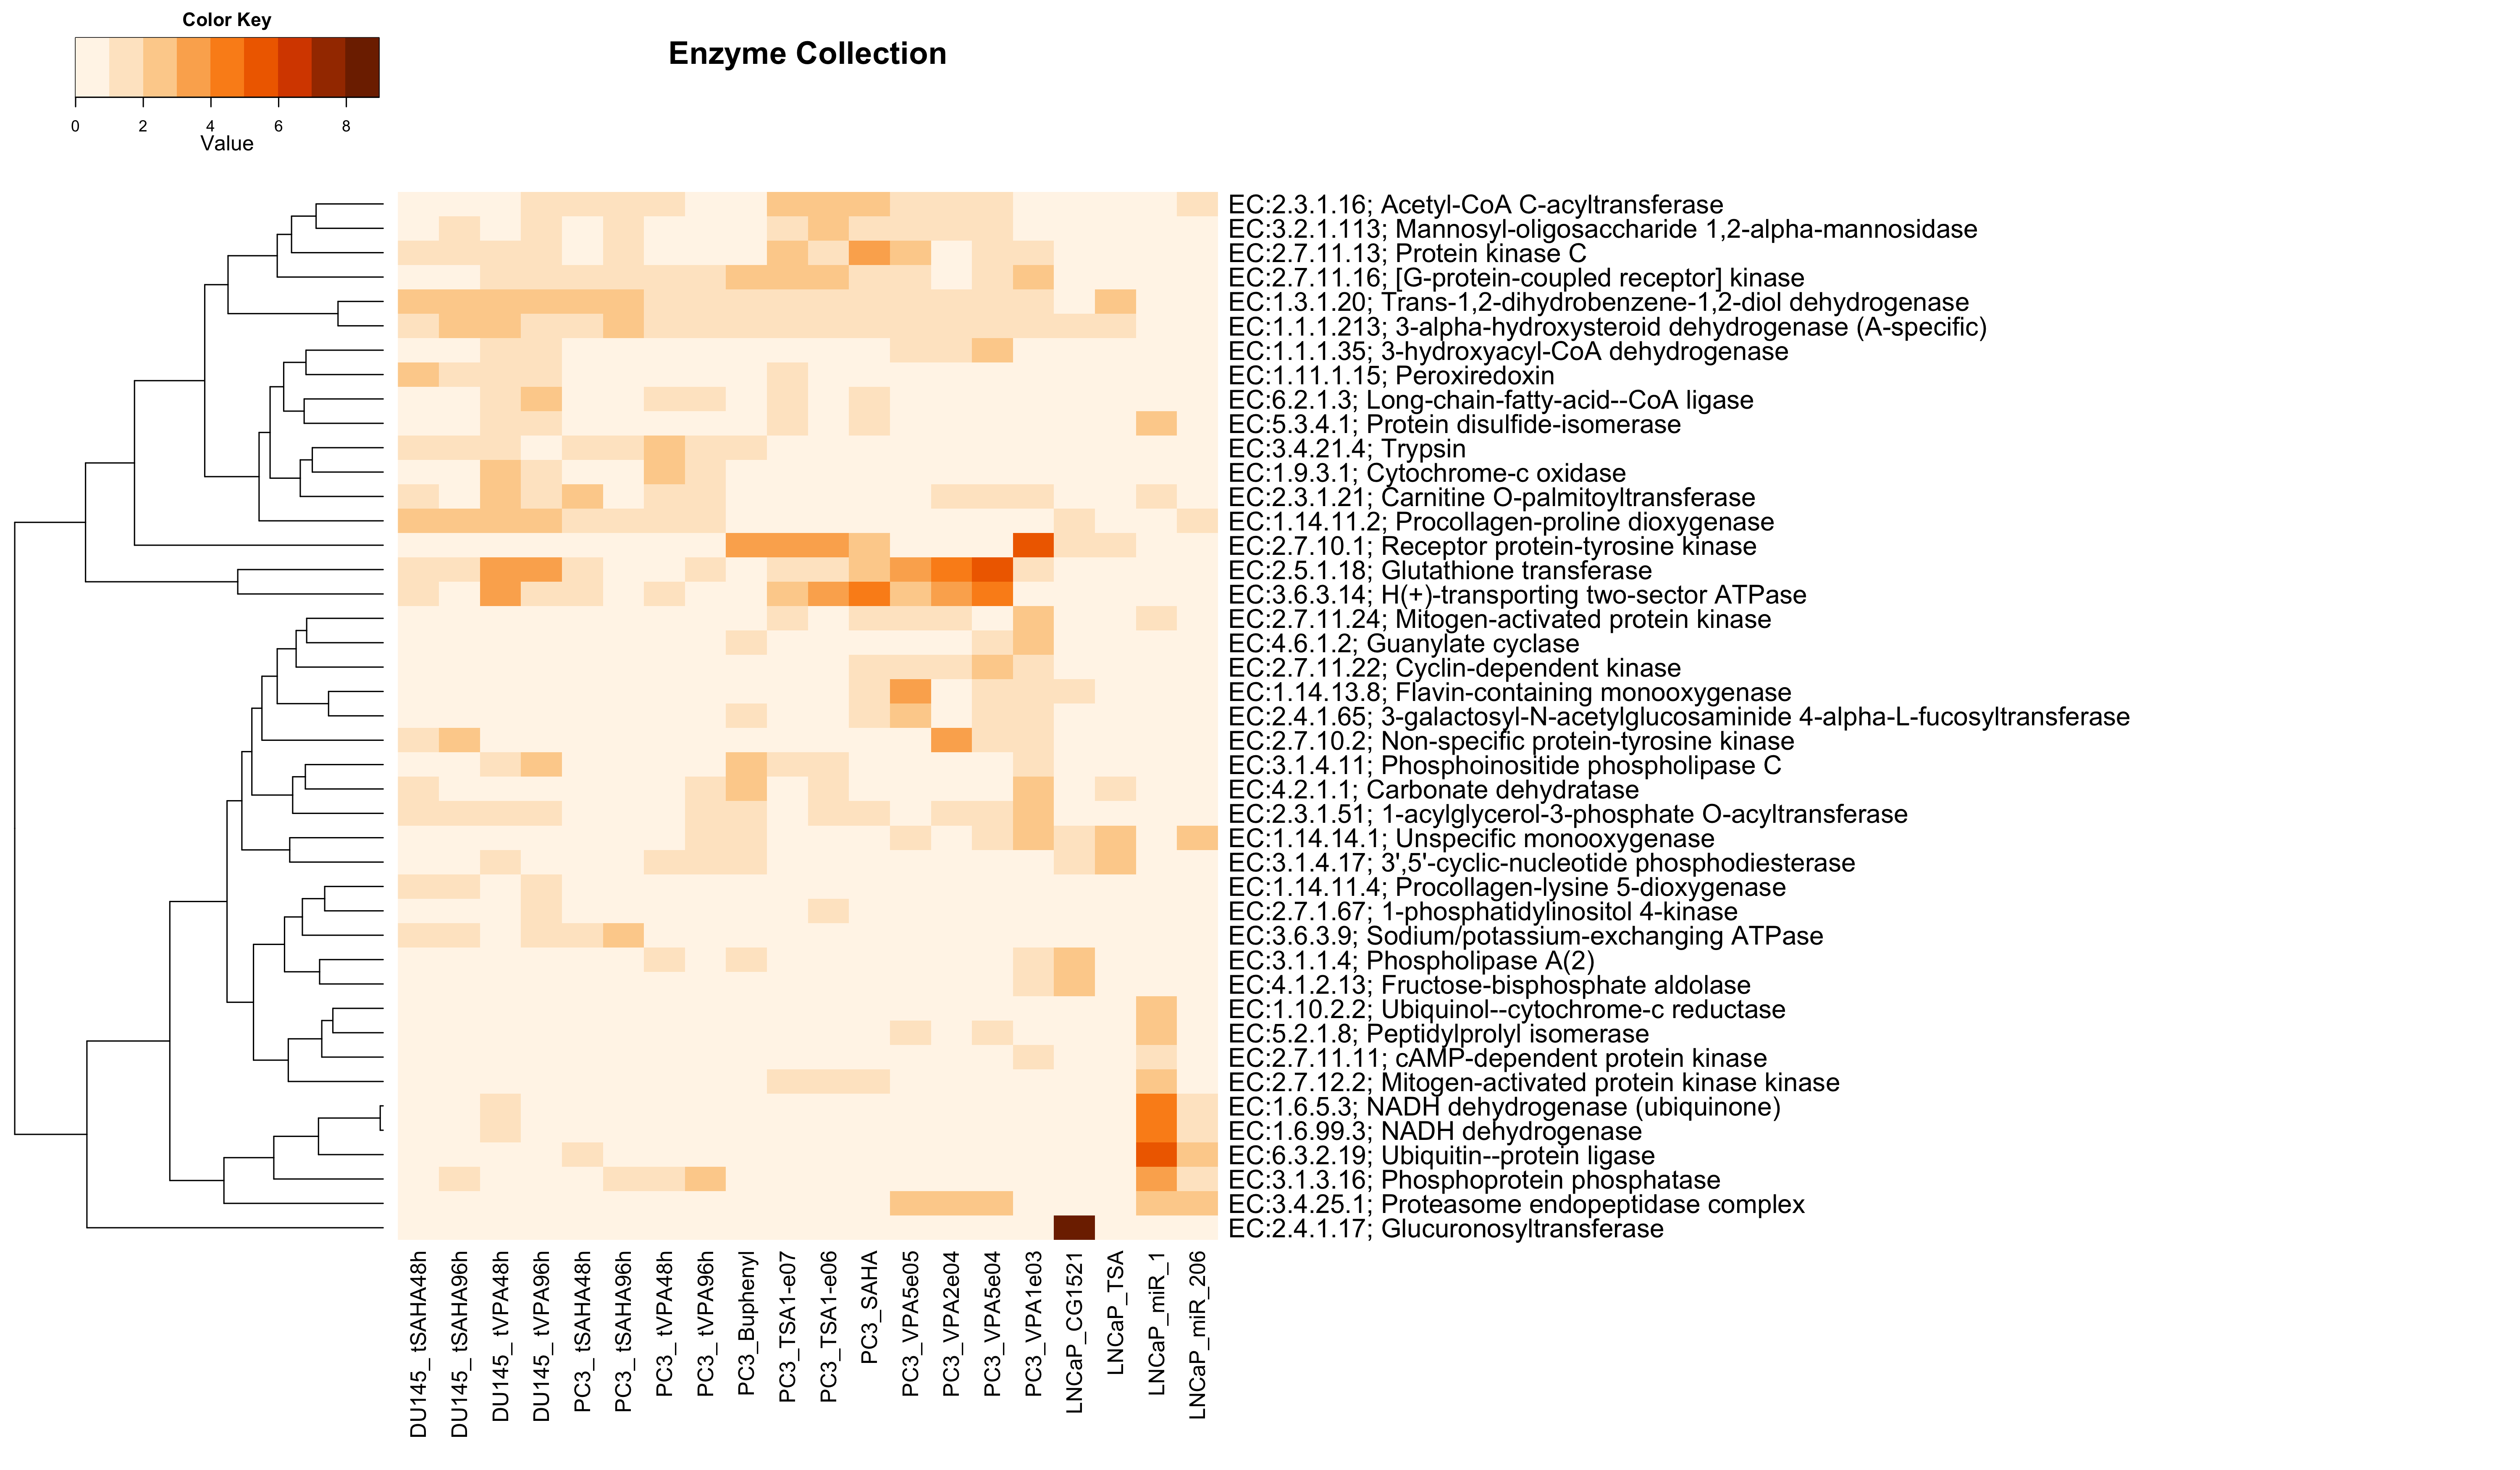
| upMax.Enzyme | Analysis of Functional Annotation for up-regulation; heatmap of the top 200 FGS enriched in at least one contrast (FDR < 0.01); the color scale represents the number of decimal digits of the unadjusted p-values from the Wlcoxon rank-sum test; results for upMax.Enzyme |
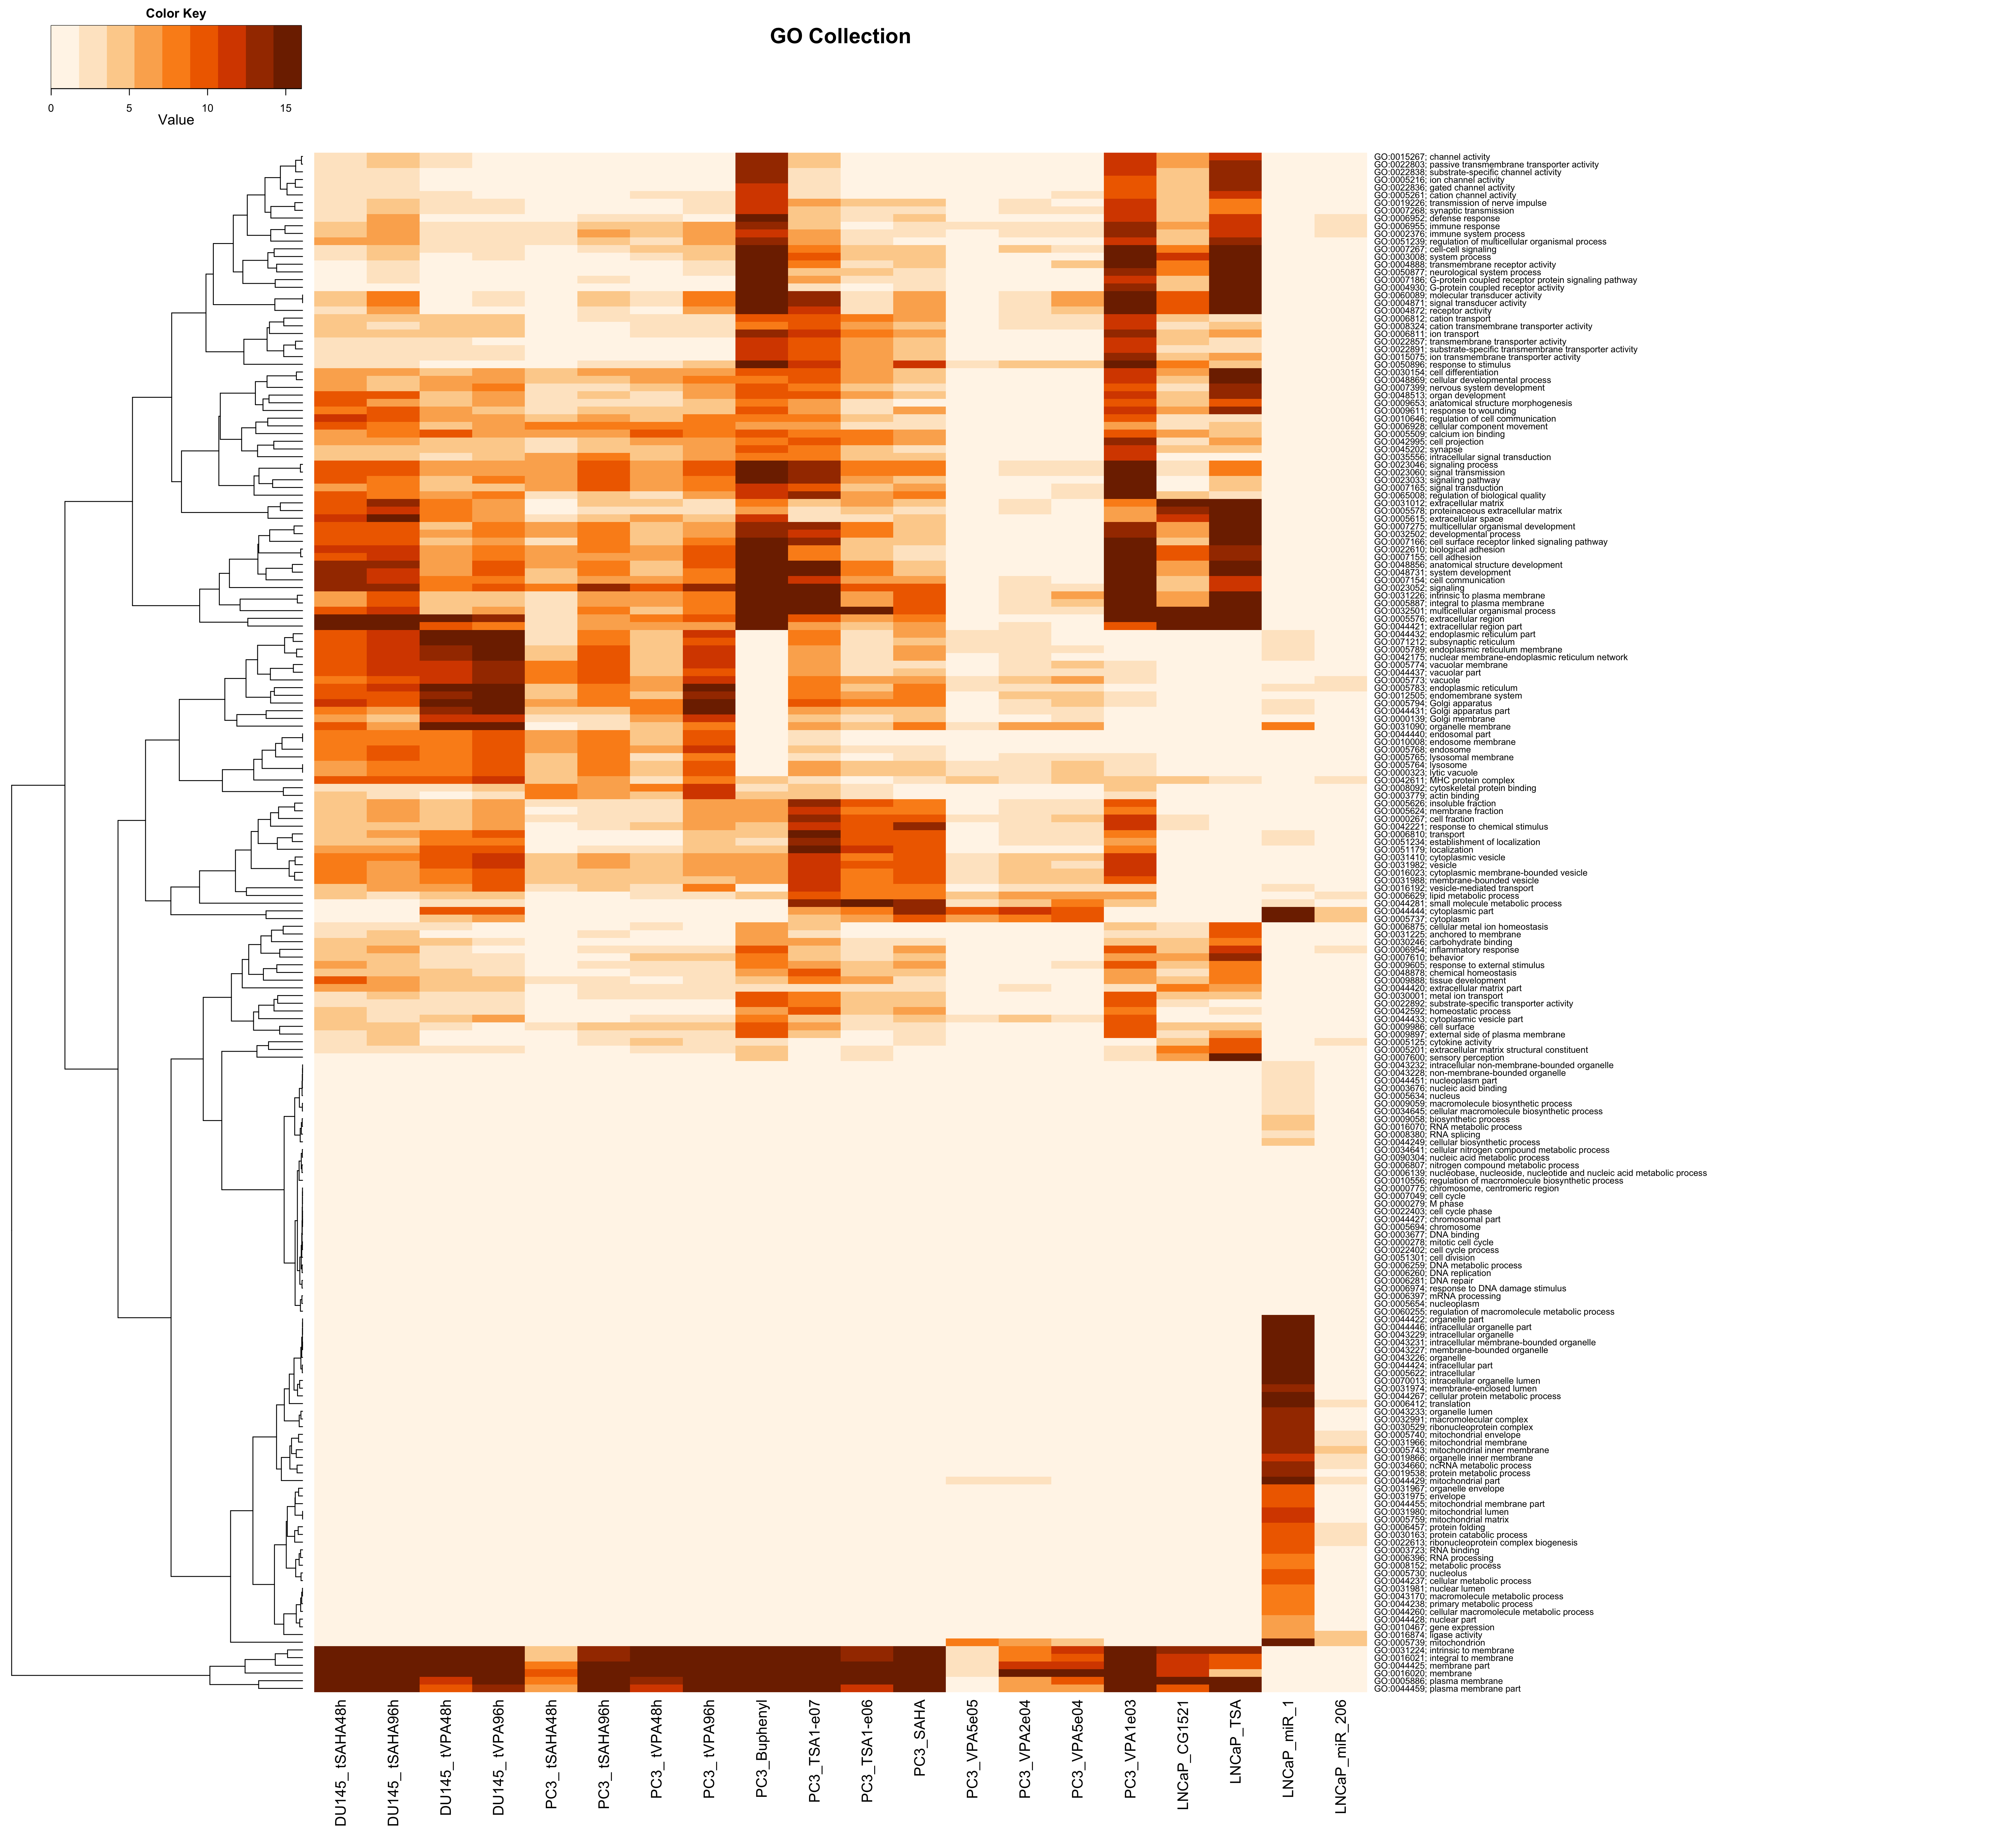
| upMax.GO | Analysis of Functional Annotation for up-regulation; heatmap of the top 200 FGS enriched in at least one contrast (FDR < 0.01); the color scale represents the number of decimal digits of the unadjusted p-values from the Wlcoxon rank-sum test; results for upMax.GO |
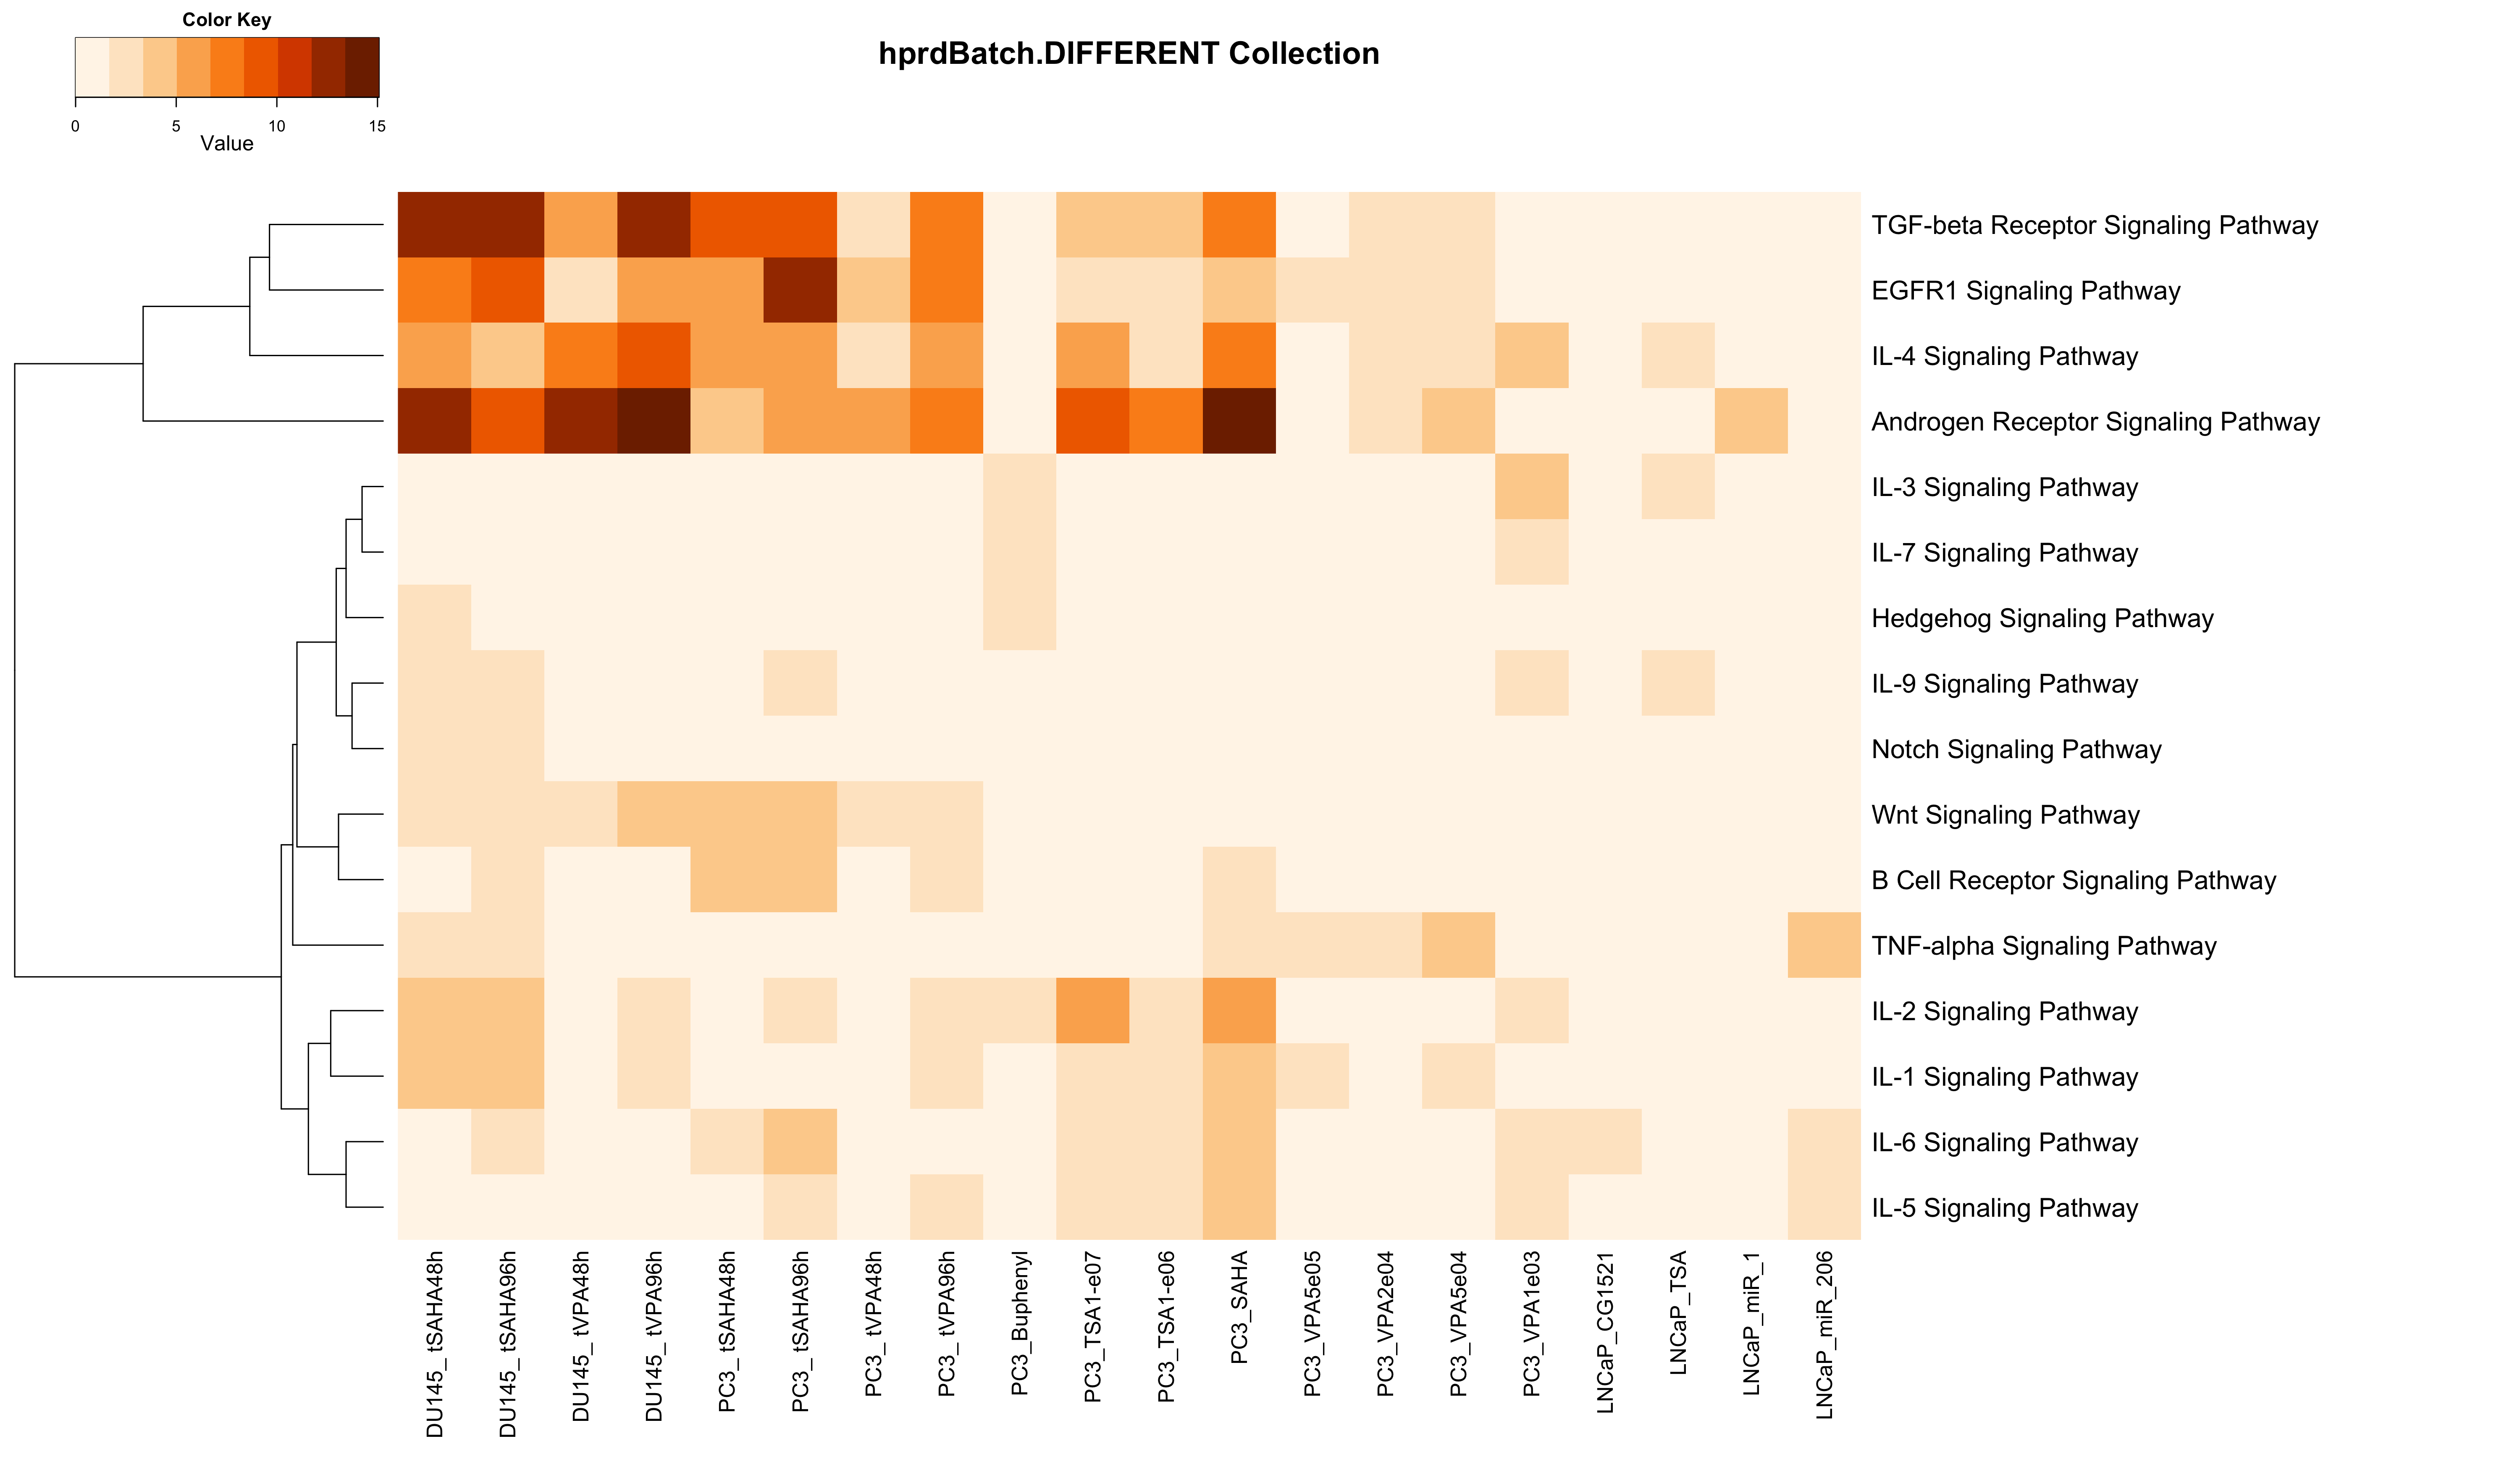
| upMax.hprdBatch.DIFFERENT | Analysis of Functional Annotation for up-regulation; heatmap of the top 200 FGS enriched in at least one contrast (FDR < 0.01); the color scale represents the number of decimal digits of the unadjusted p-values from the Wlcoxon rank-sum test; results for upMax.hprdBatch.DIFFERENT |
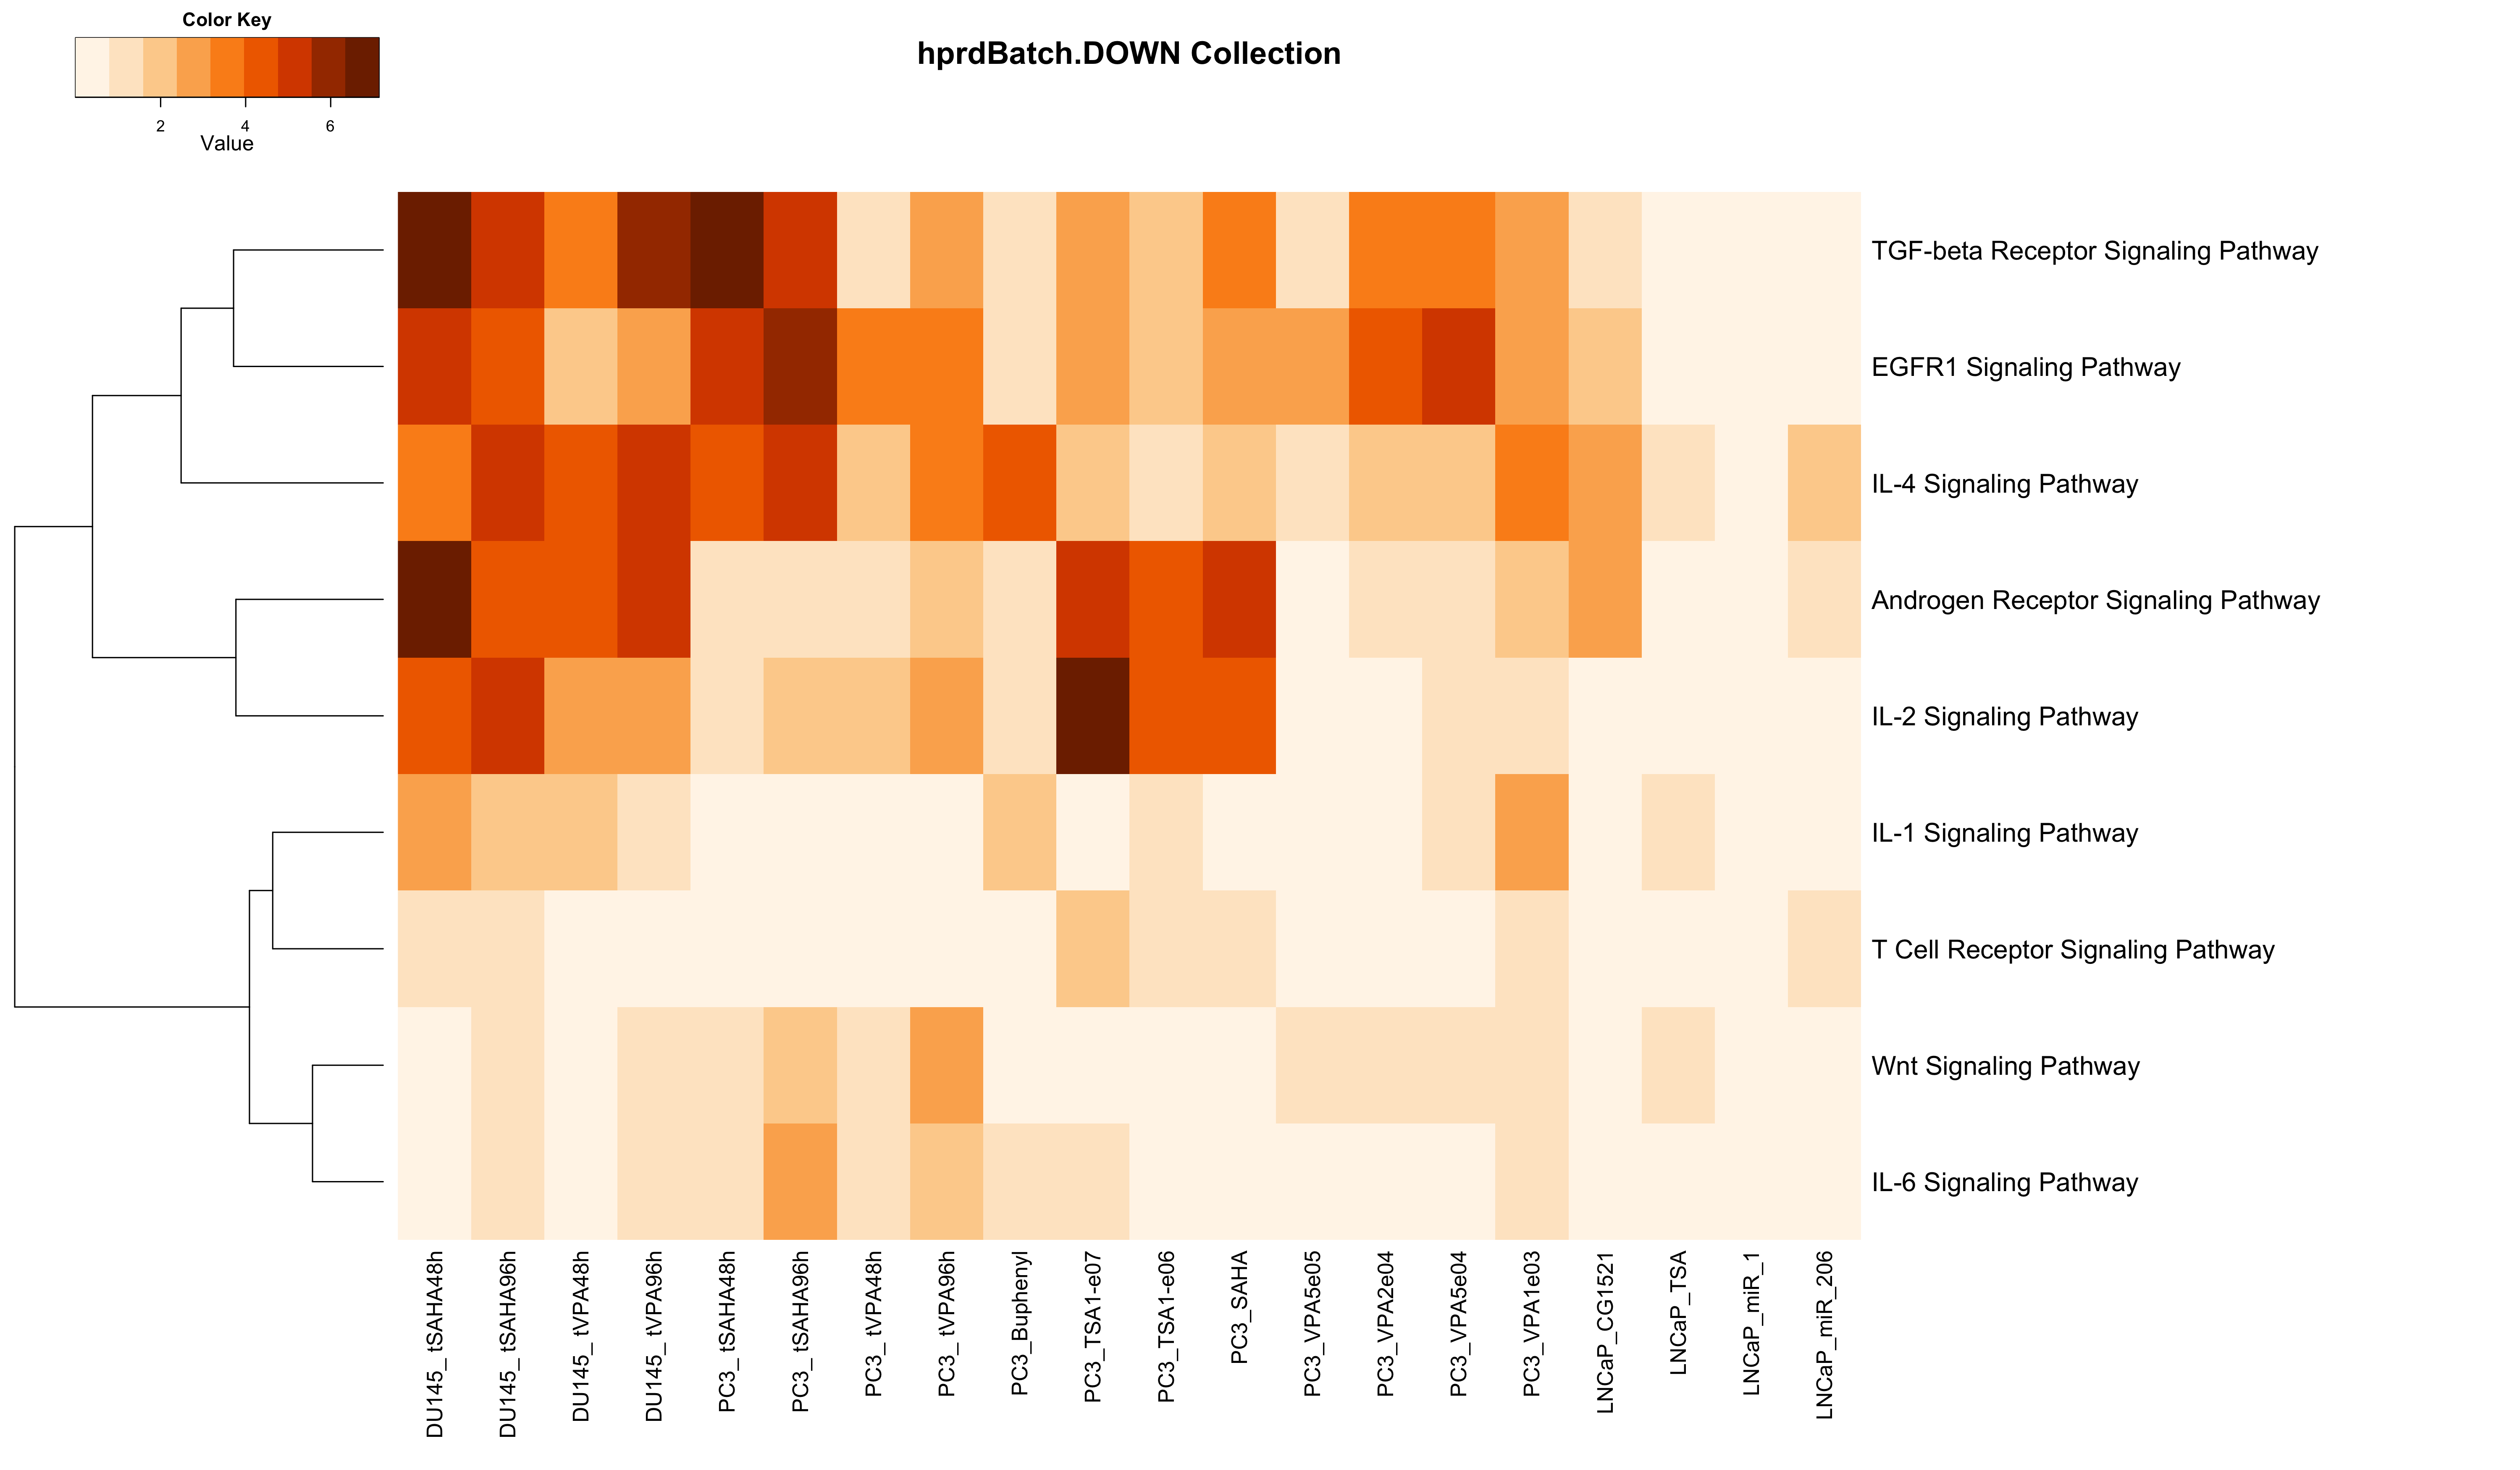
| upMax.hprdBatch.DOWN | Analysis of Functional Annotation for up-regulation; heatmap of the top 200 FGS enriched in at least one contrast (FDR < 0.01); the color scale represents the number of decimal digits of the unadjusted p-values from the Wlcoxon rank-sum test; results for upMax.hprdBatch.DOWN |
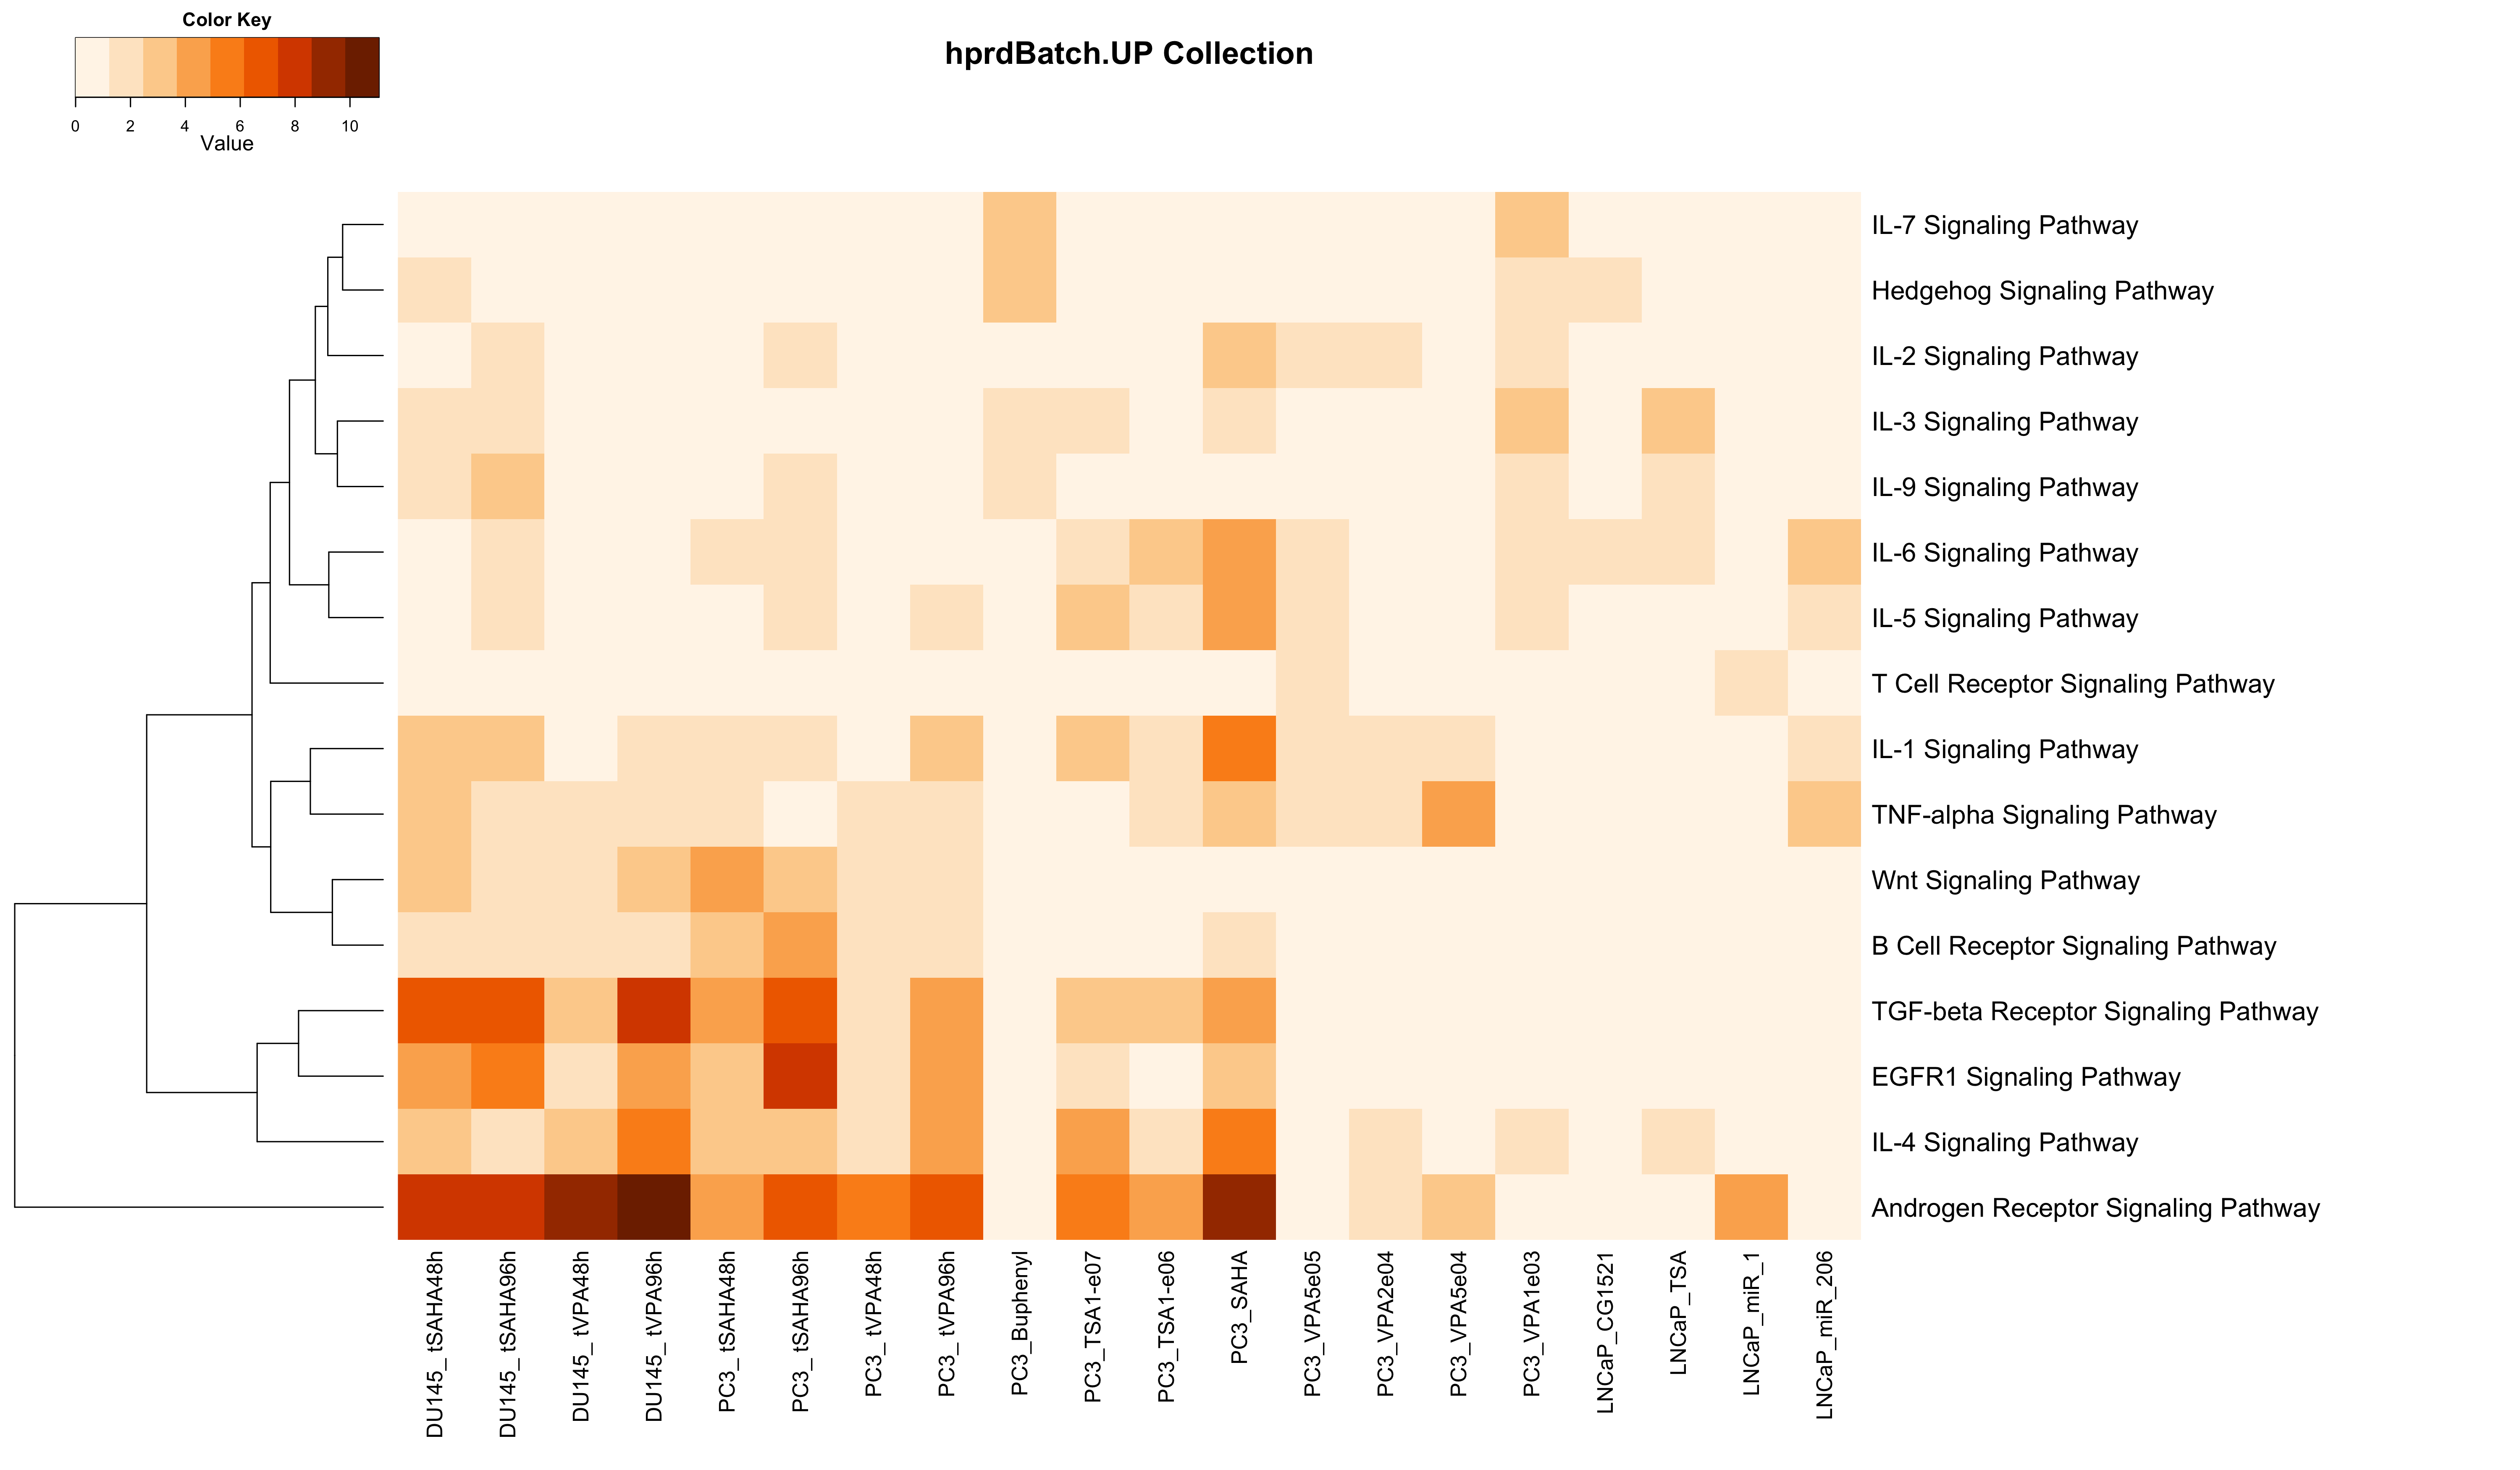
| upMax.hprdBatch.UP | Analysis of Functional Annotation for up-regulation; heatmap of the top 200 FGS enriched in at least one contrast (FDR < 0.01); the color scale represents the number of decimal digits of the unadjusted p-values from the Wlcoxon rank-sum test; results for upMax.hprdBatch.UP |
| upMax.hprdManual.DIFFERENT | Analysis of Functional Annotation for up-regulation; heatmap of the top 200 FGS enriched in at least one contrast (FDR < 0.01); the color scale represents the number of decimal digits of the unadjusted p-values from the Wlcoxon rank-sum test; results for upMax.hprdManual.DIFFERENT |
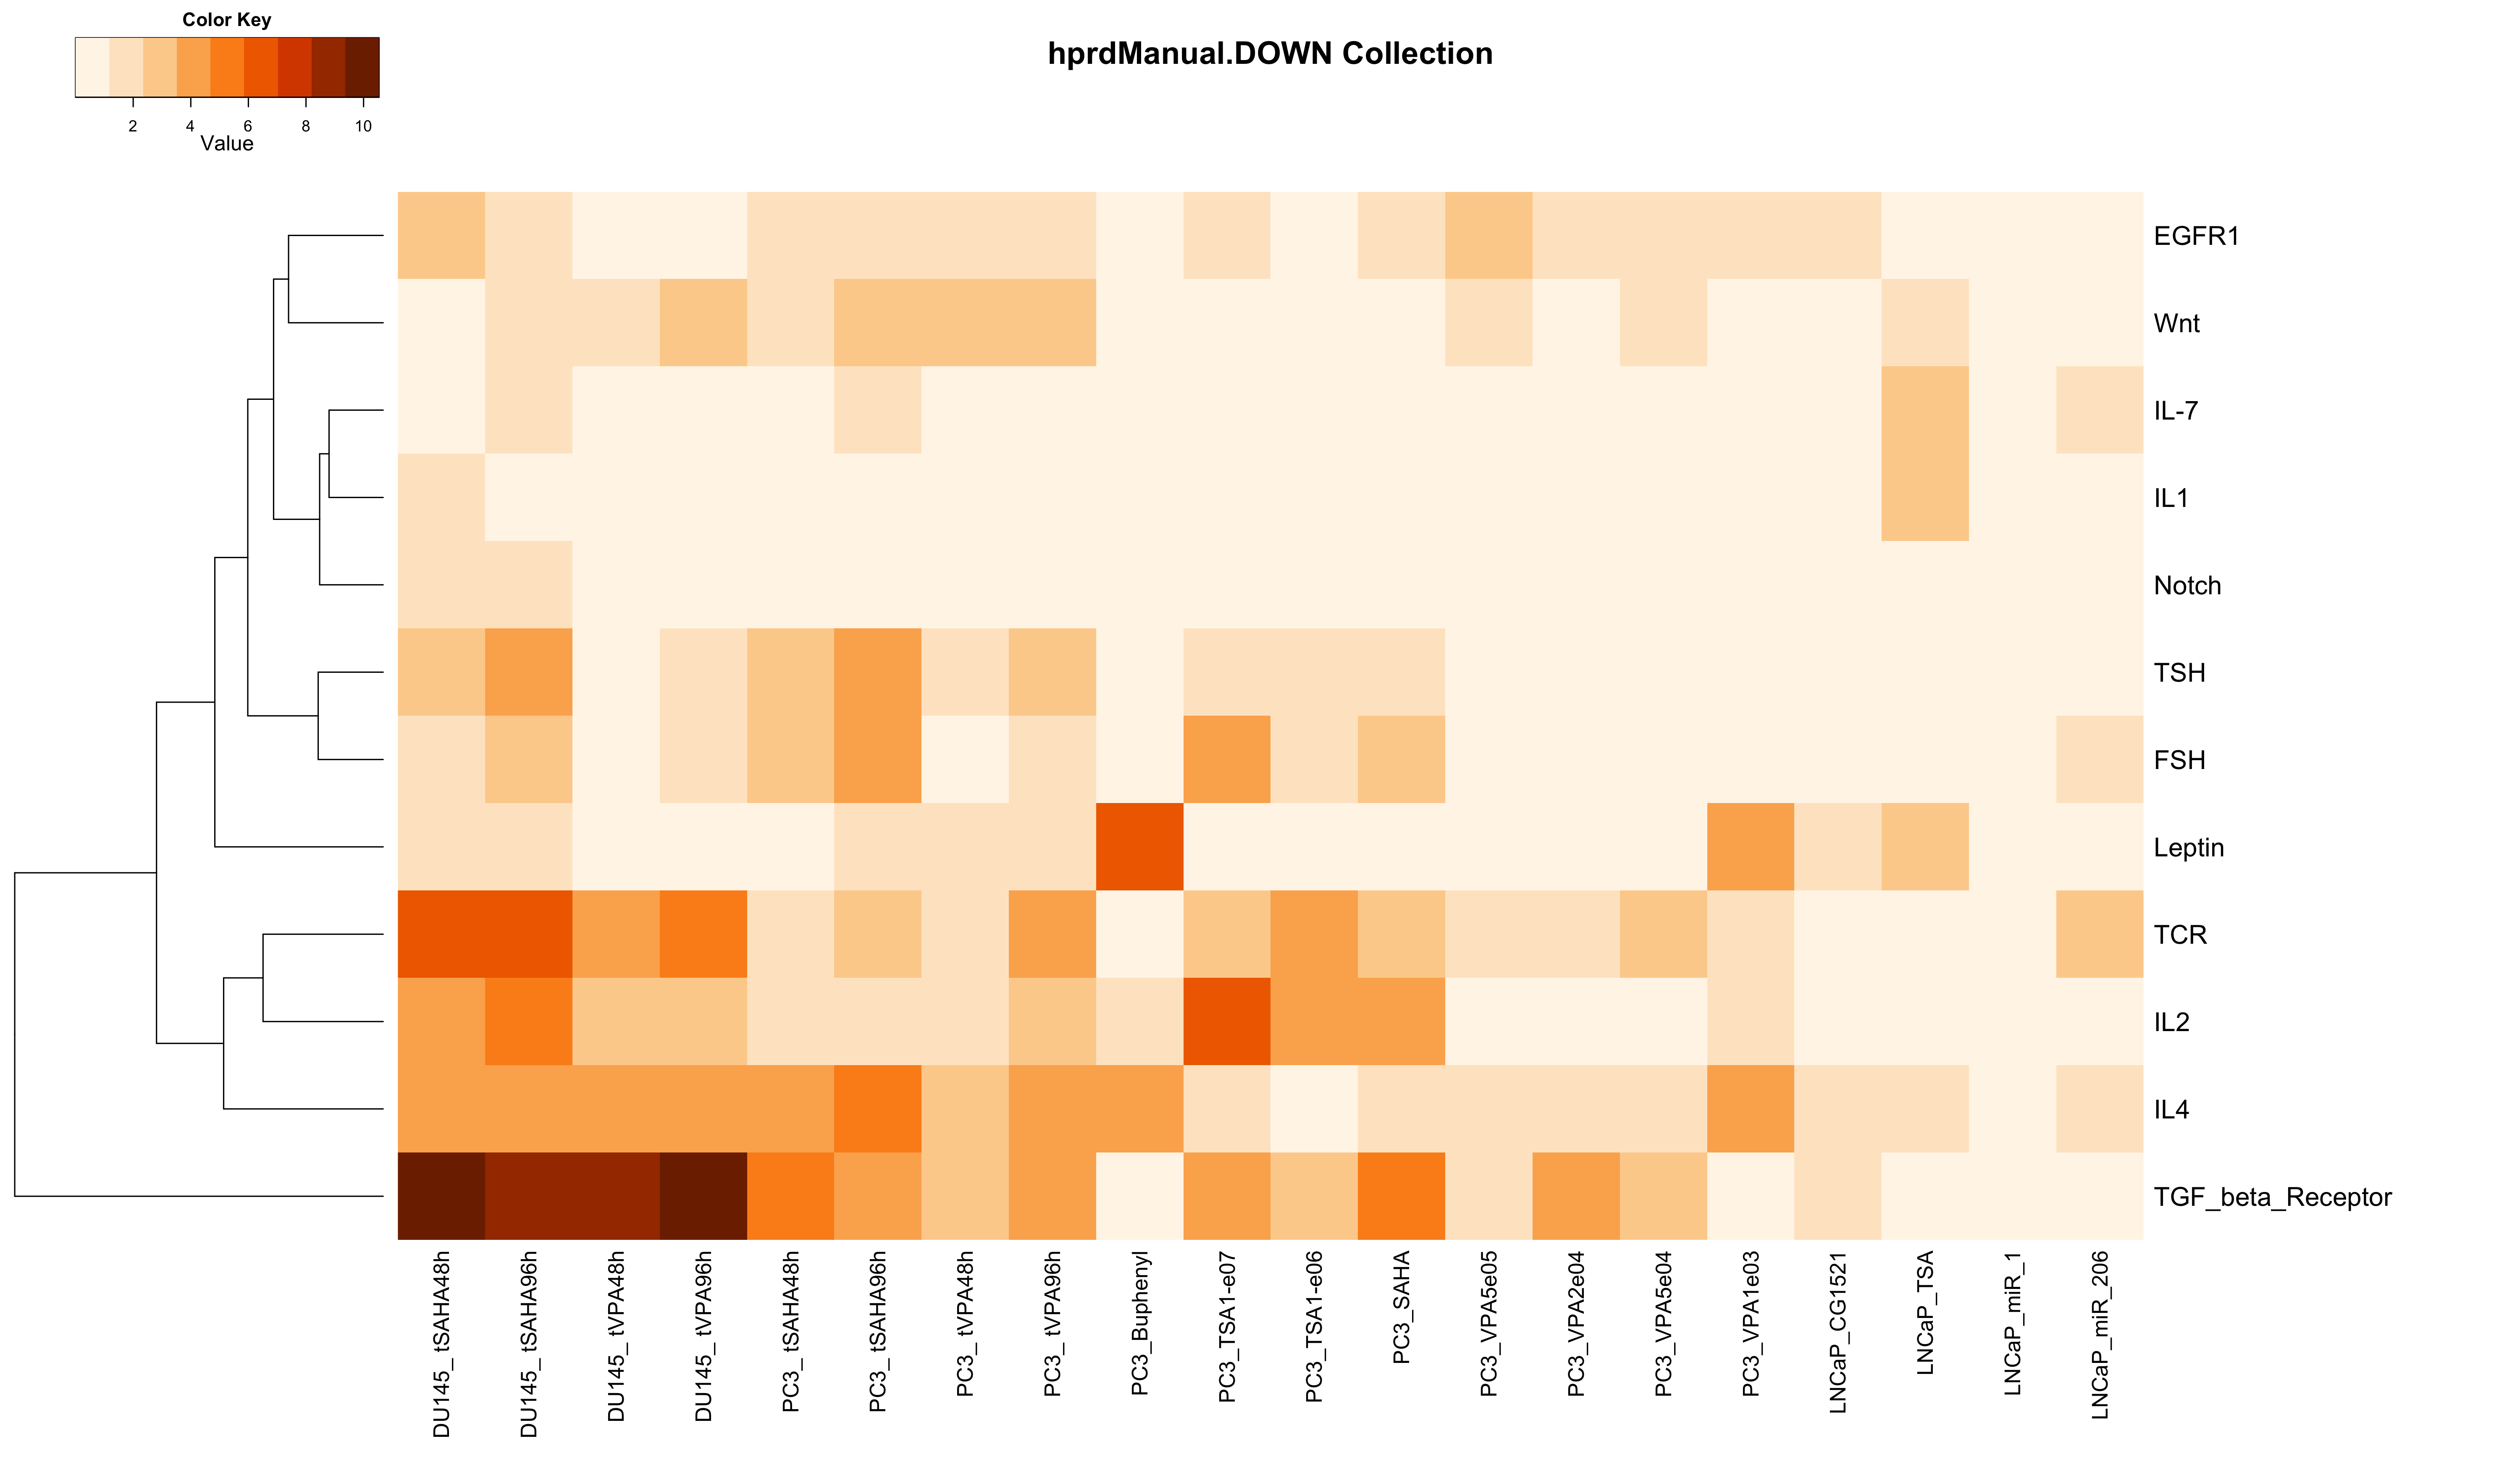
| upMax.hprdManual.DOWN | Analysis of Functional Annotation for up-regulation; heatmap of the top 200 FGS enriched in at least one contrast (FDR < 0.01); the color scale represents the number of decimal digits of the unadjusted p-values from the Wlcoxon rank-sum test; results for upMax.hprdManual.DOWN |
| upMax.hprdManual.UP | Analysis of Functional Annotation for up-regulation; heatmap of the top 200 FGS enriched in at least one contrast (FDR < 0.01); the color scale represents the number of decimal digits of the unadjusted p-values from the Wlcoxon rank-sum test; results for upMax.hprdManual.UP |
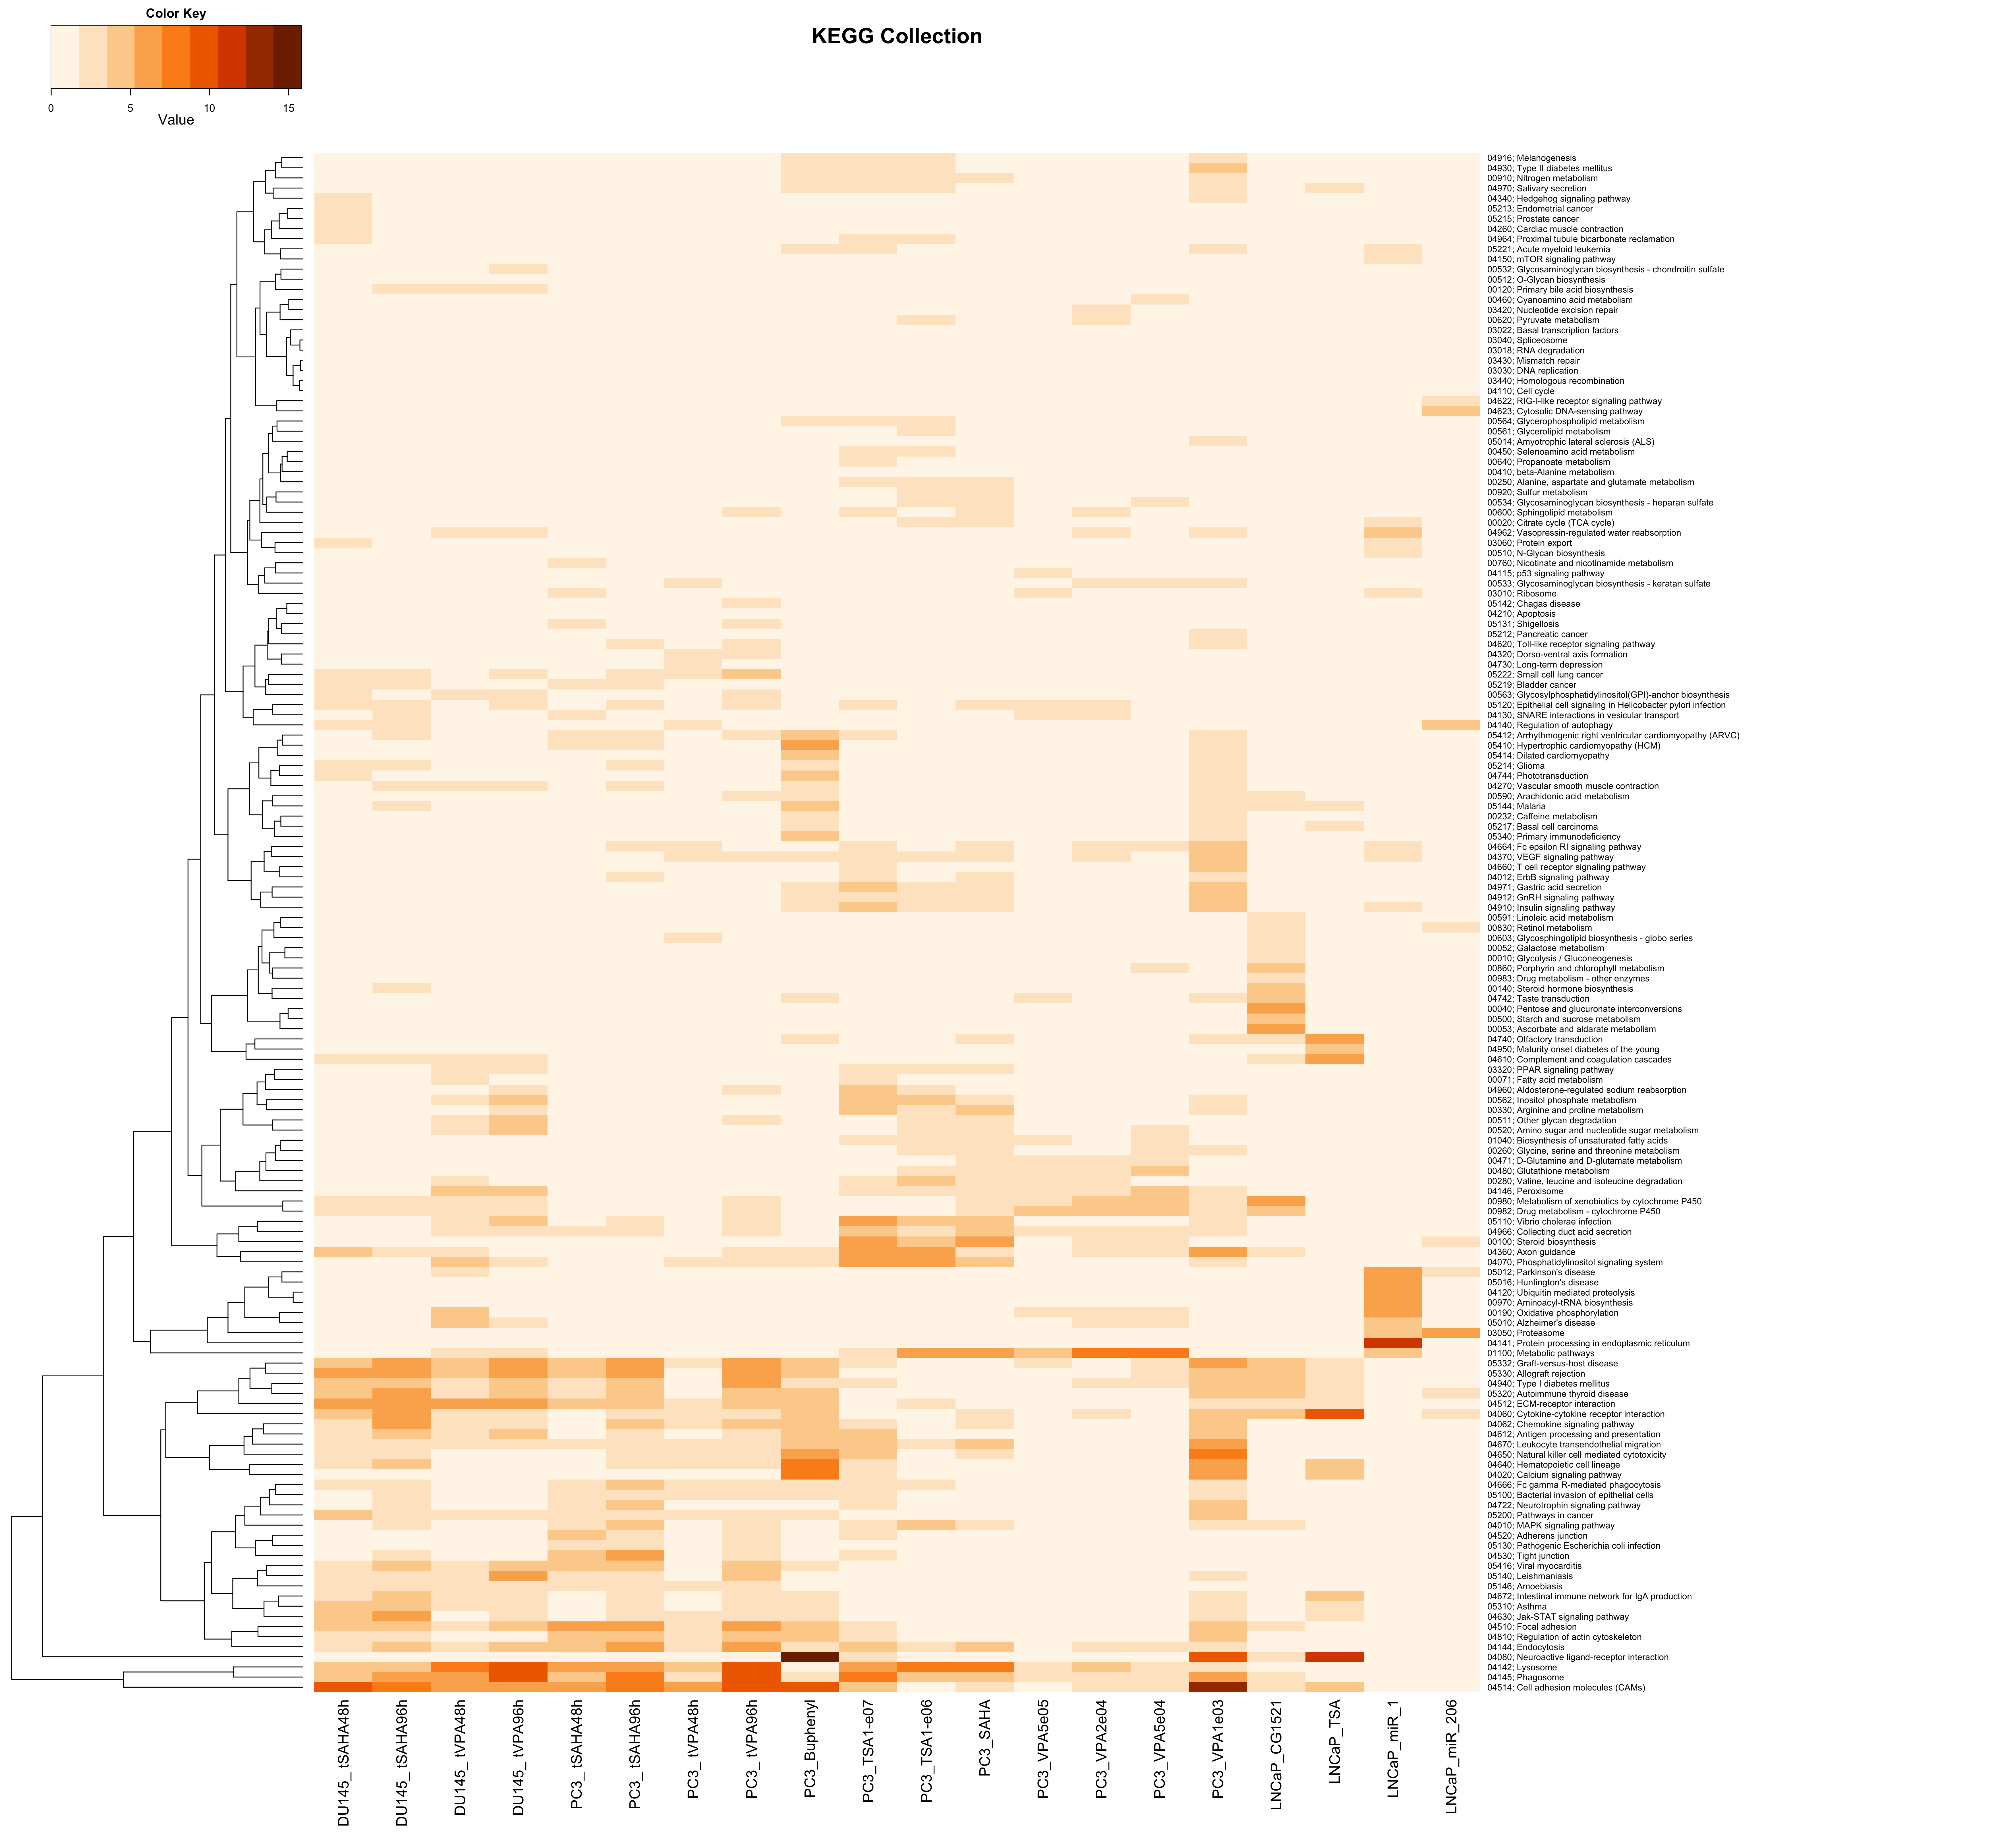
| upMax.KEGG | Analysis of Functional Annotation for up-regulation; heatmap of the top 200 FGS enriched in at least one contrast (FDR < 0.01); the color scale represents the number of decimal digits of the unadjusted p-values from the Wlcoxon rank-sum test; results for upMax.KEGG |
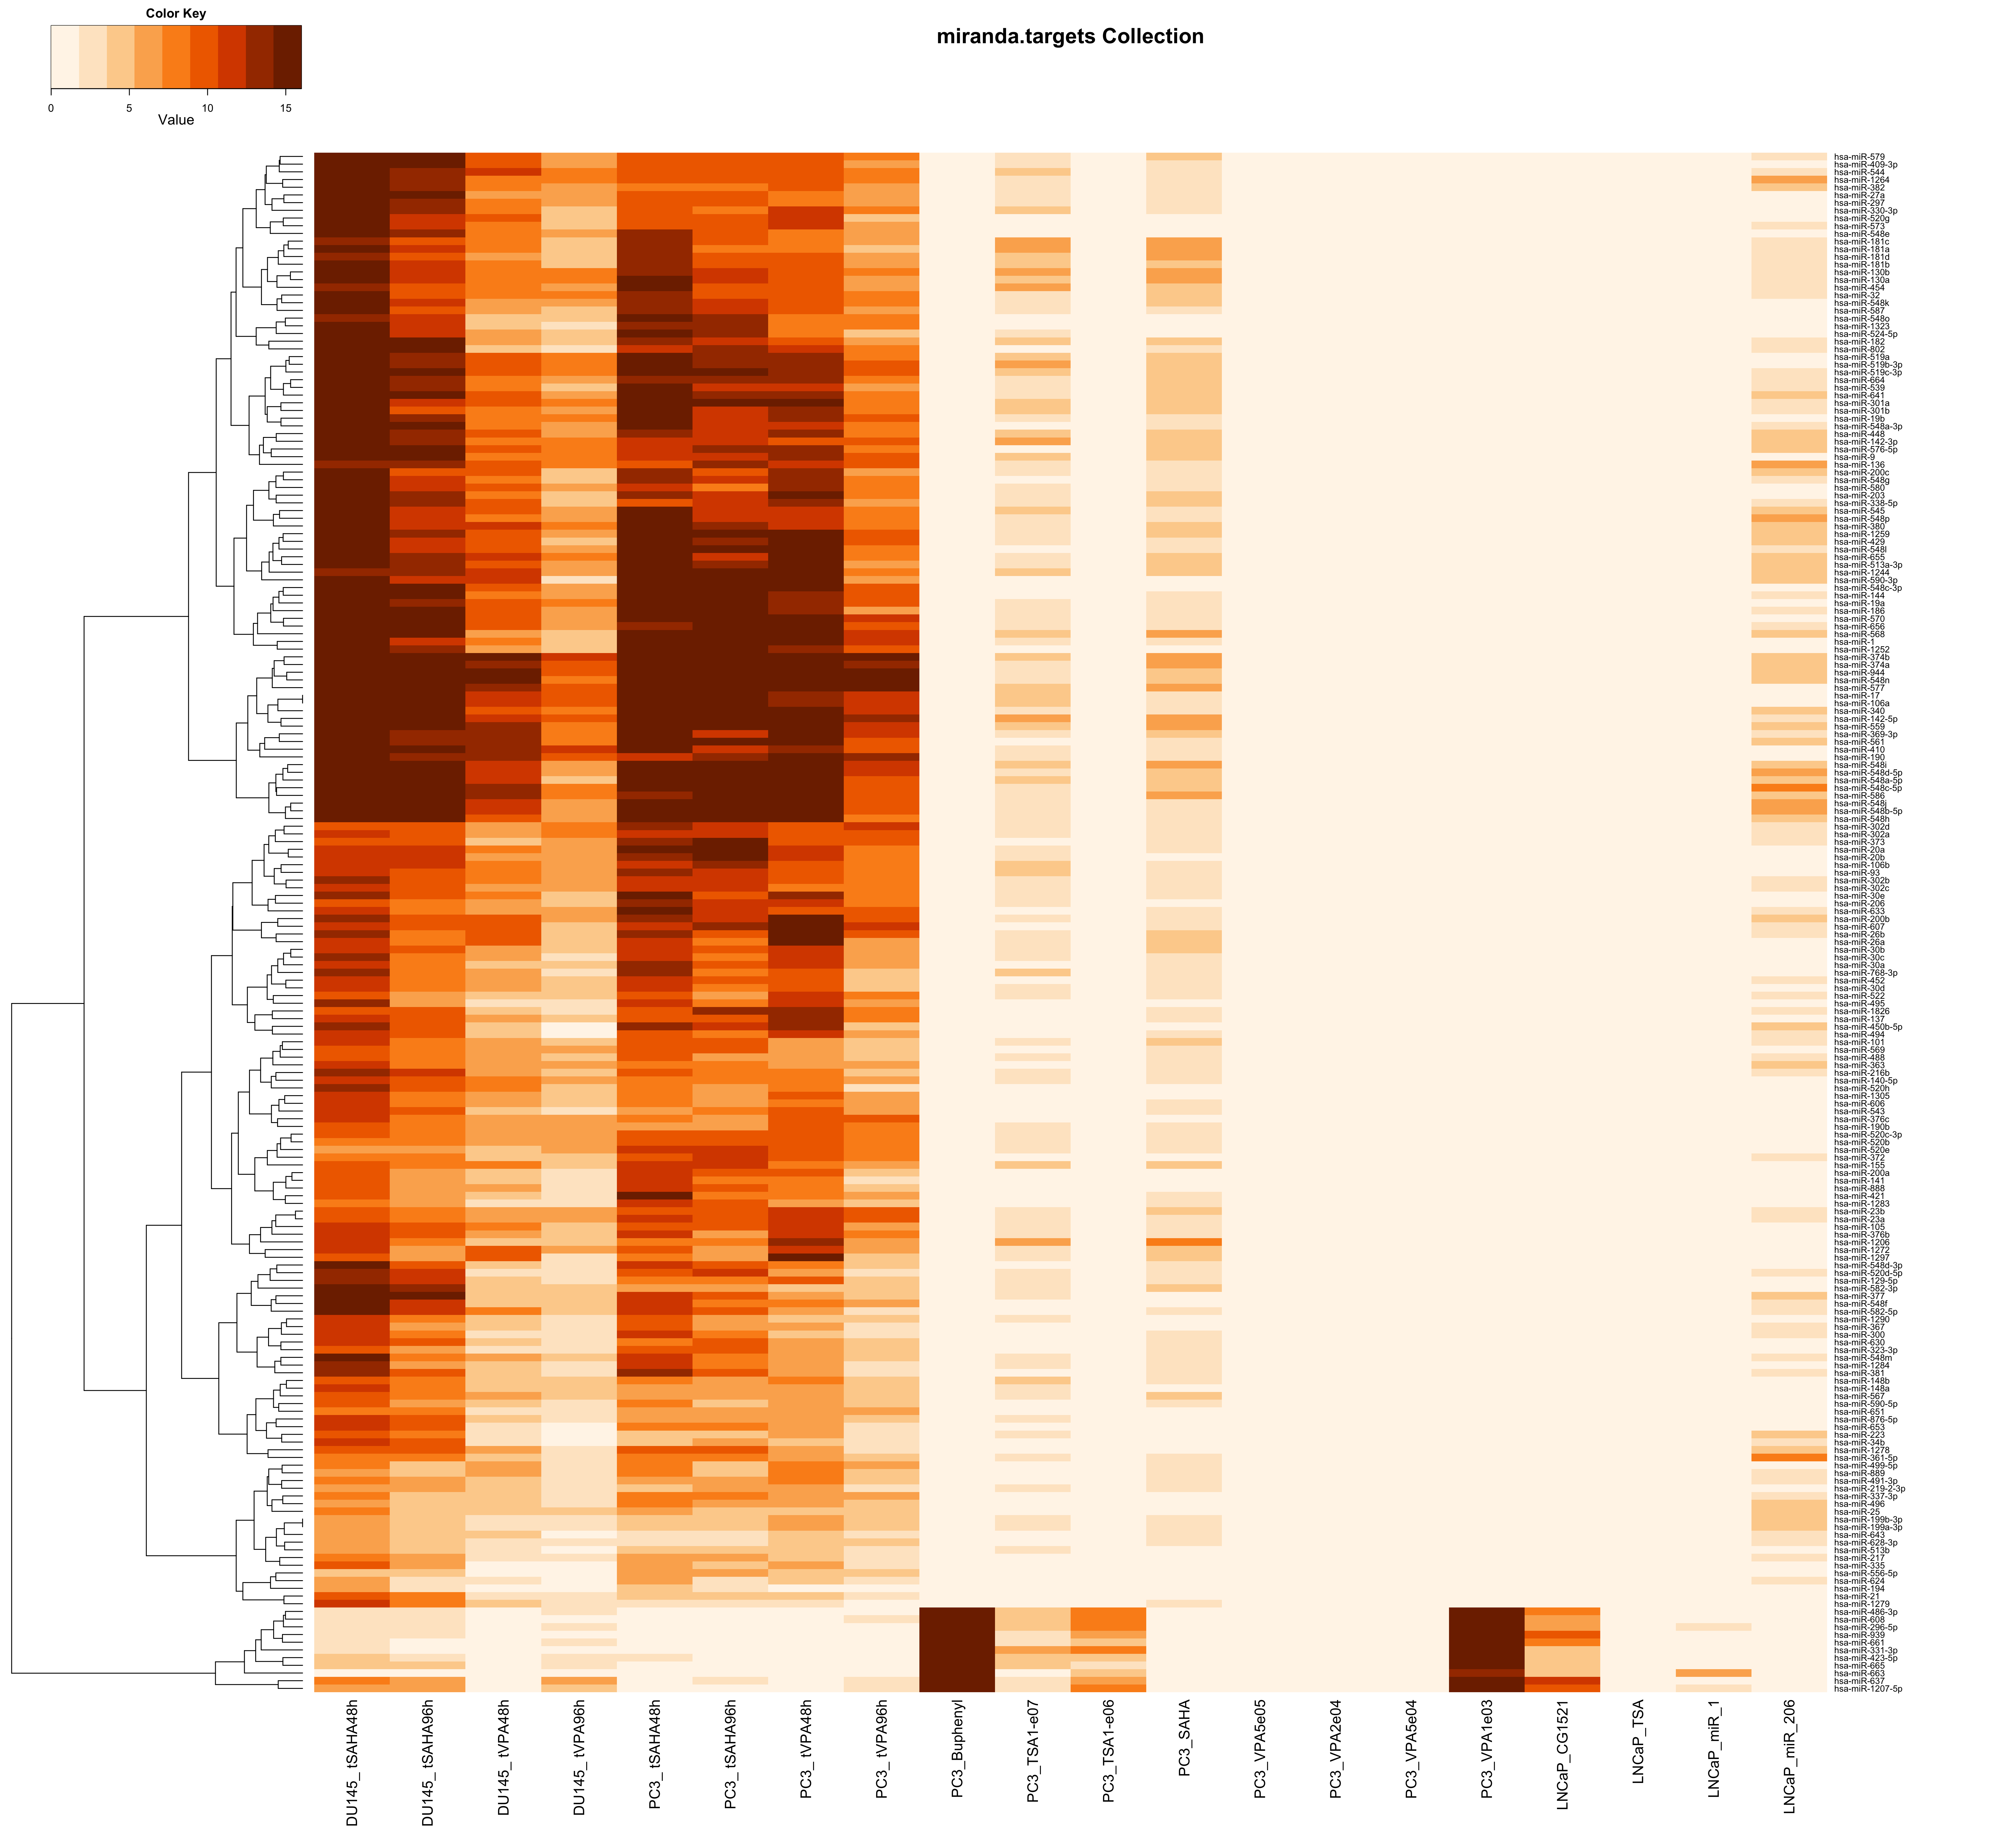
| upMax.miranda.targets | Analysis of Functional Annotation for up-regulation; heatmap of the top 200 FGS enriched in at least one contrast (FDR < 0.01); the color scale represents the number of decimal digits of the unadjusted p-values from the Wlcoxon rank-sum test; results for upMax.miranda.targets |
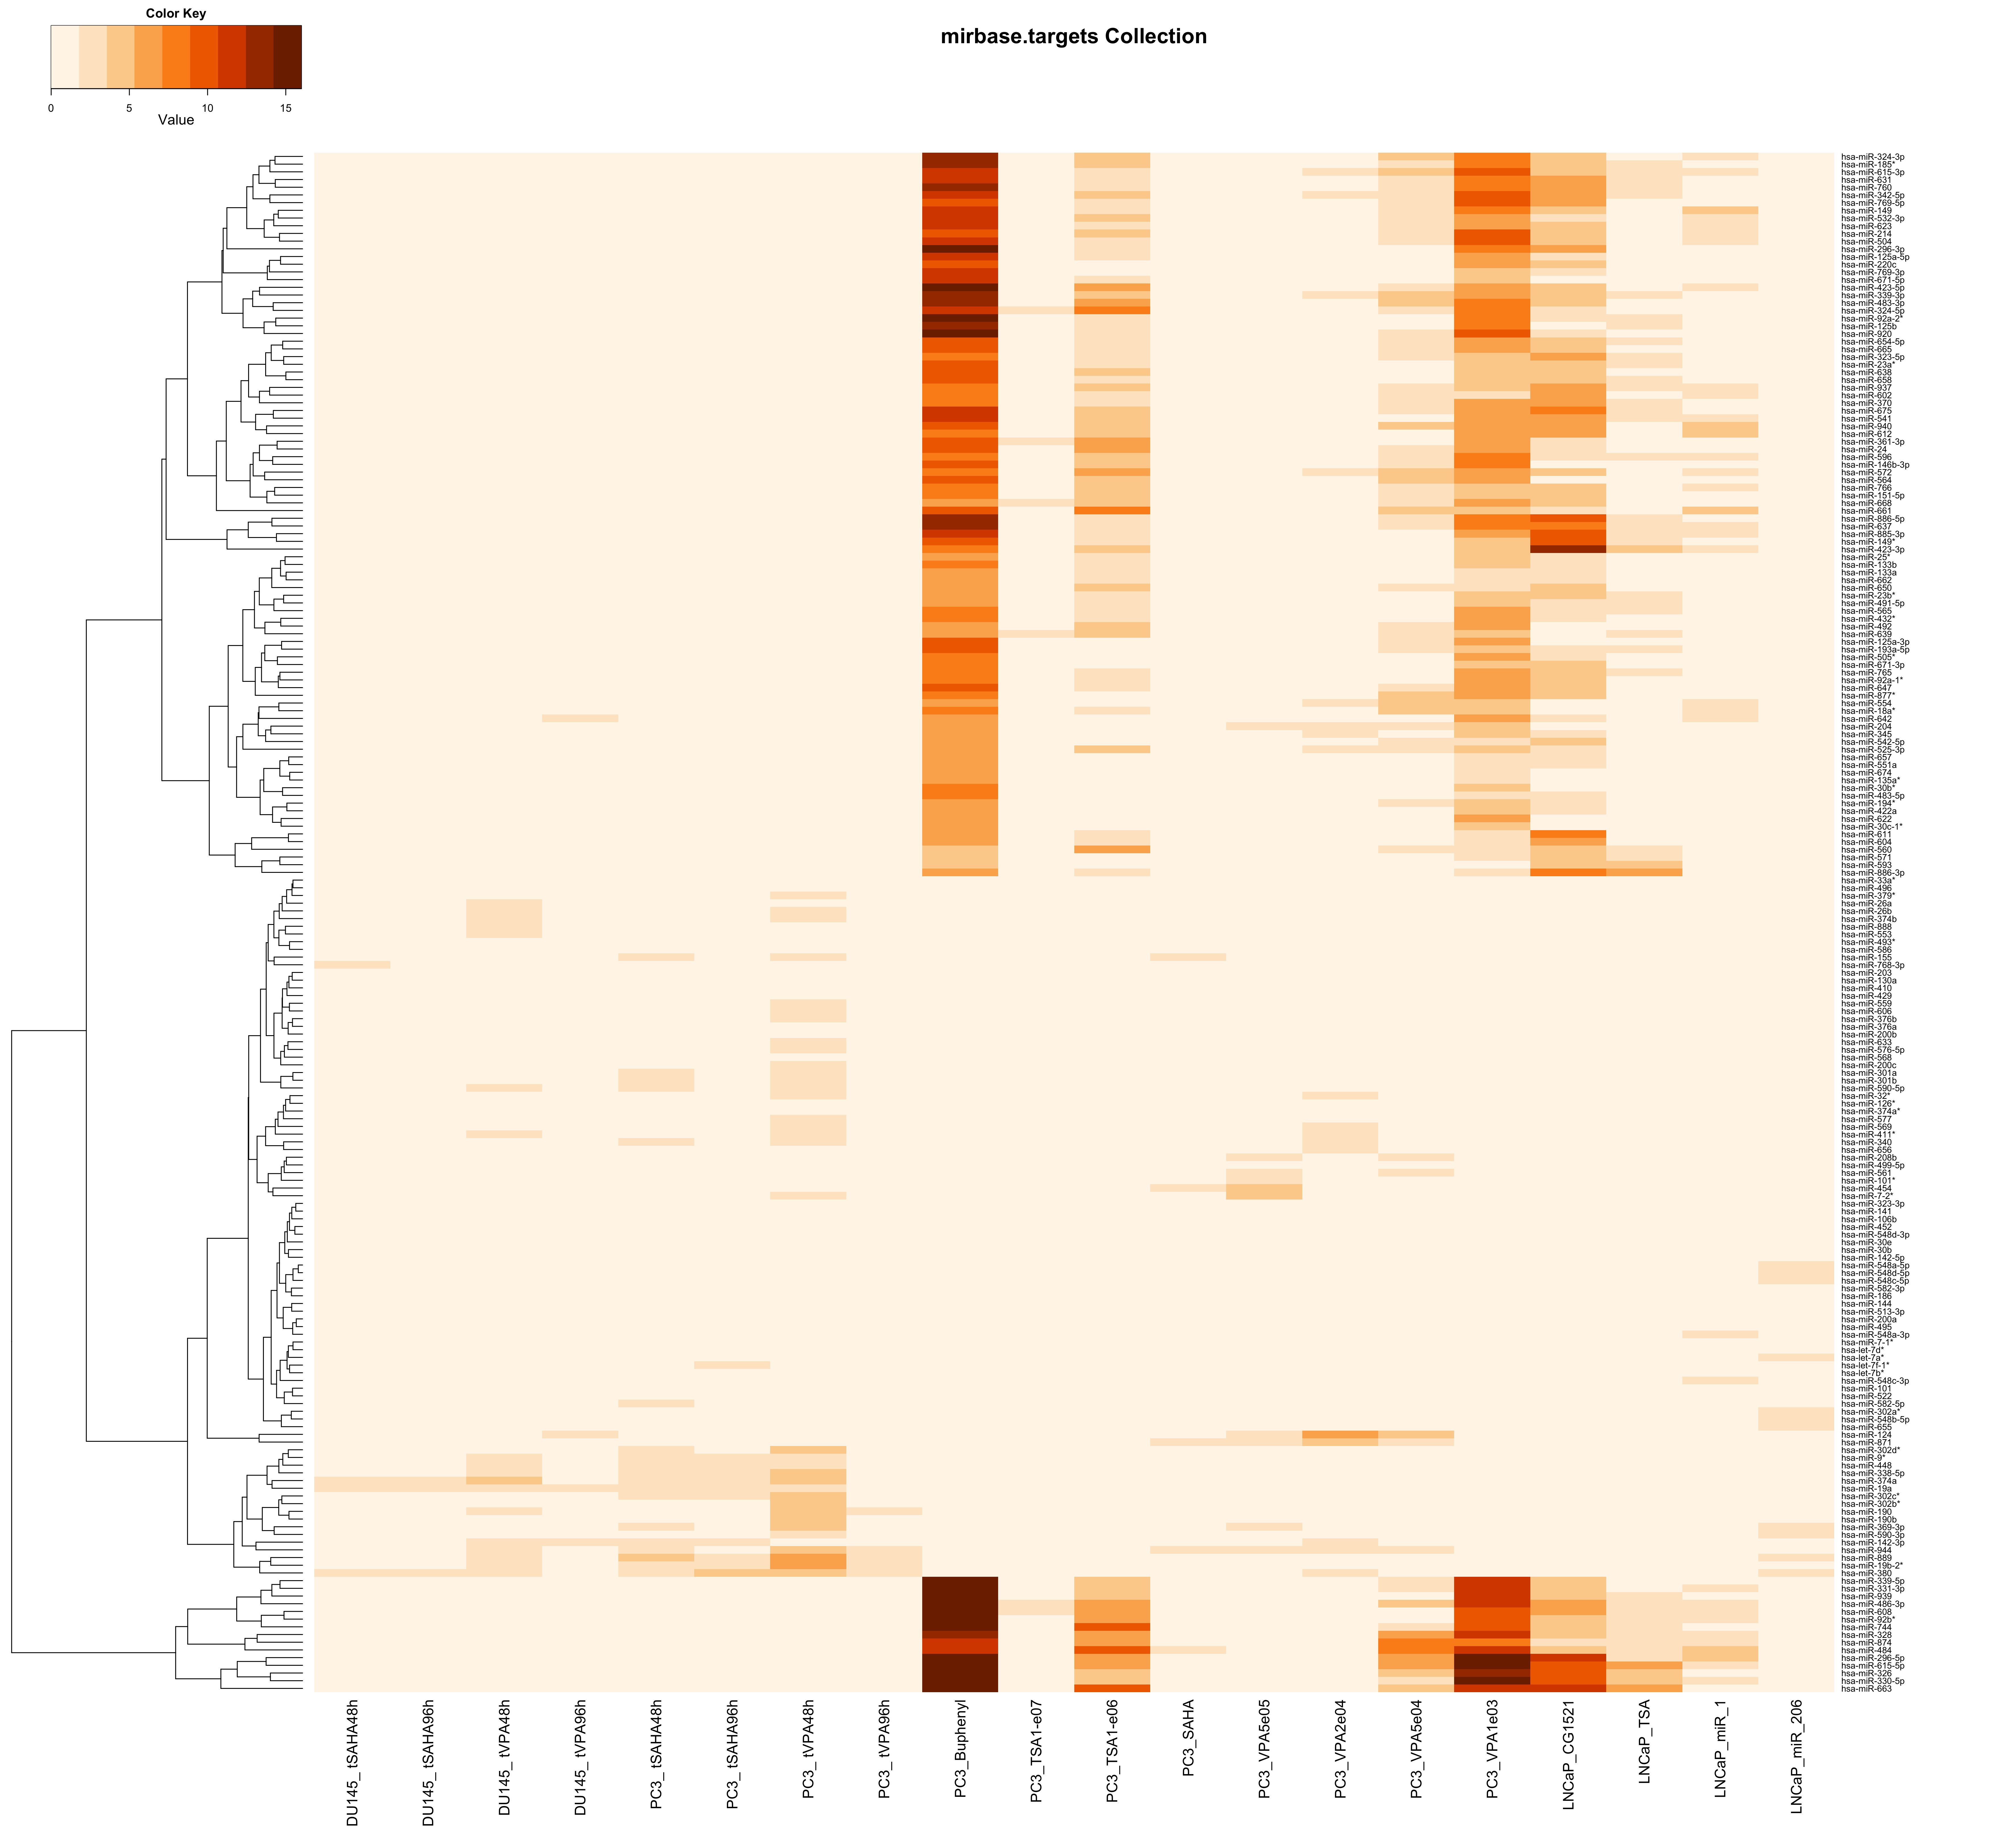
| upMax.mirbase.targets | Analysis of Functional Annotation for up-regulation; heatmap of the top 200 FGS enriched in at least one contrast (FDR < 0.01); the color scale represents the number of decimal digits of the unadjusted p-values from the Wlcoxon rank-sum test; results for upMax.mirbase.targets |
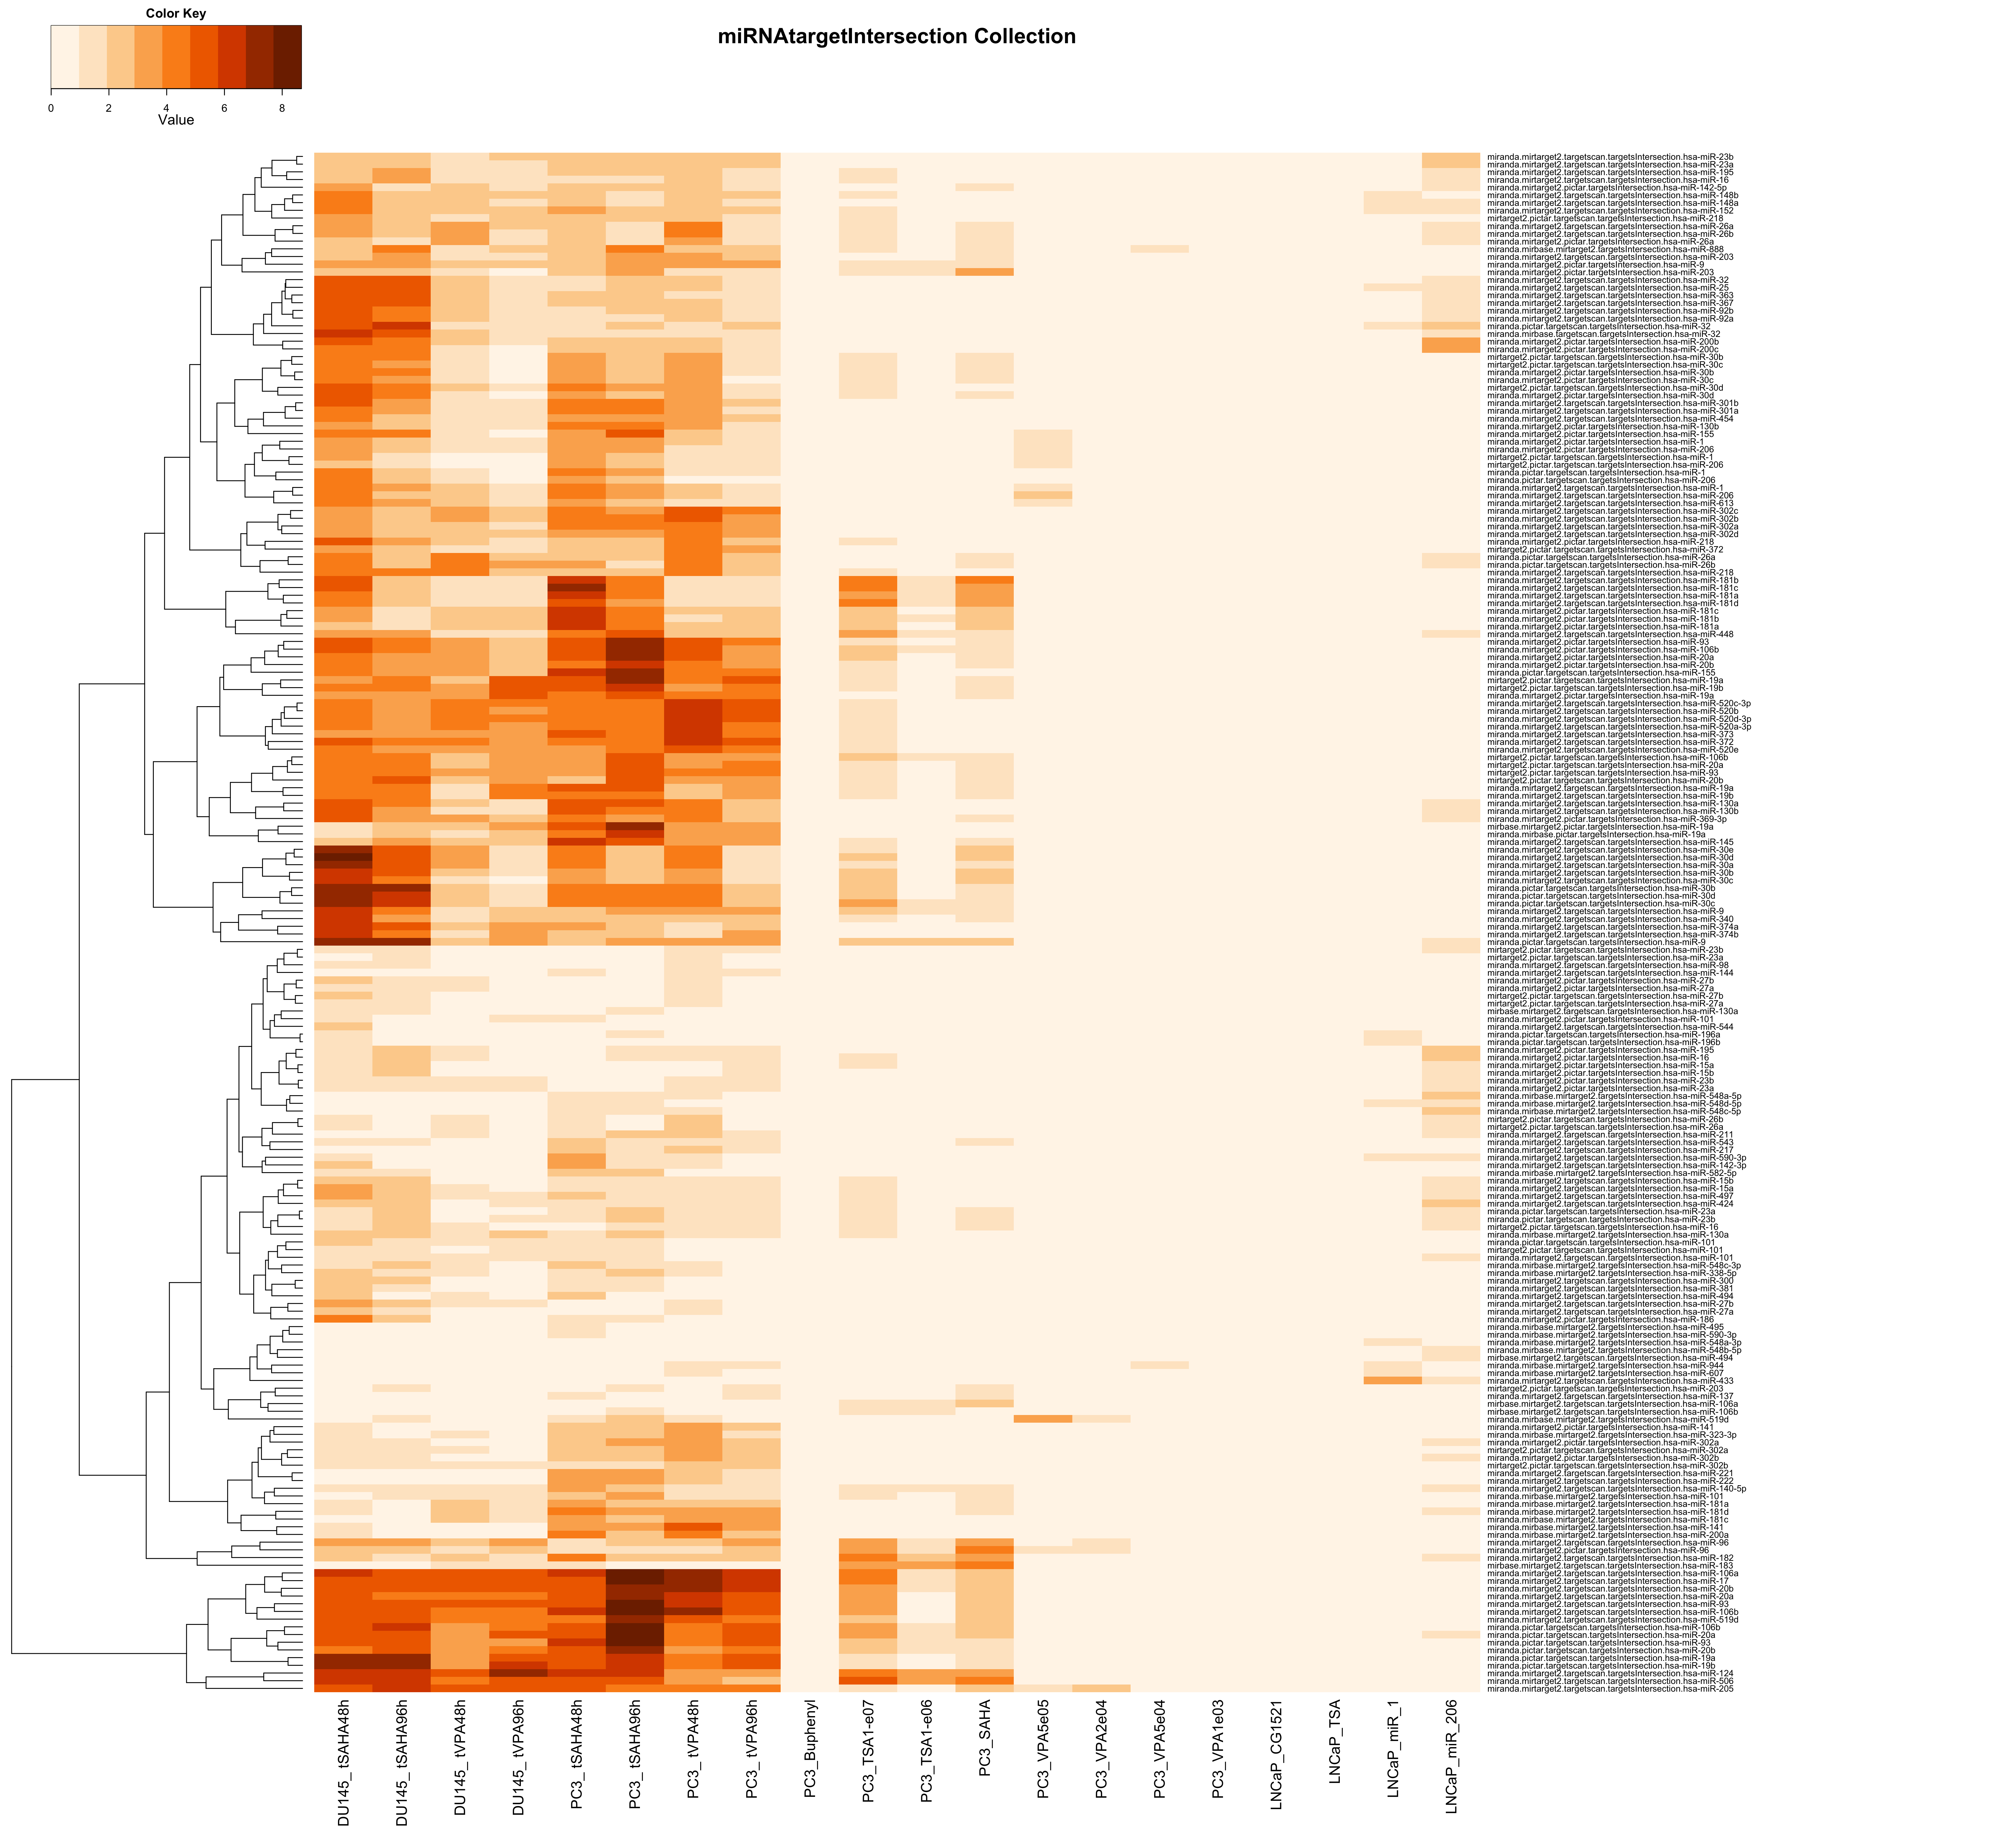
| upMax.miRNAtargetIntersection | Analysis of Functional Annotation for up-regulation; heatmap of the top 200 FGS enriched in at least one contrast (FDR < 0.01); the color scale represents the number of decimal digits of the unadjusted p-values from the Wlcoxon rank-sum test; results for upMax.miRNAtargetIntersection |
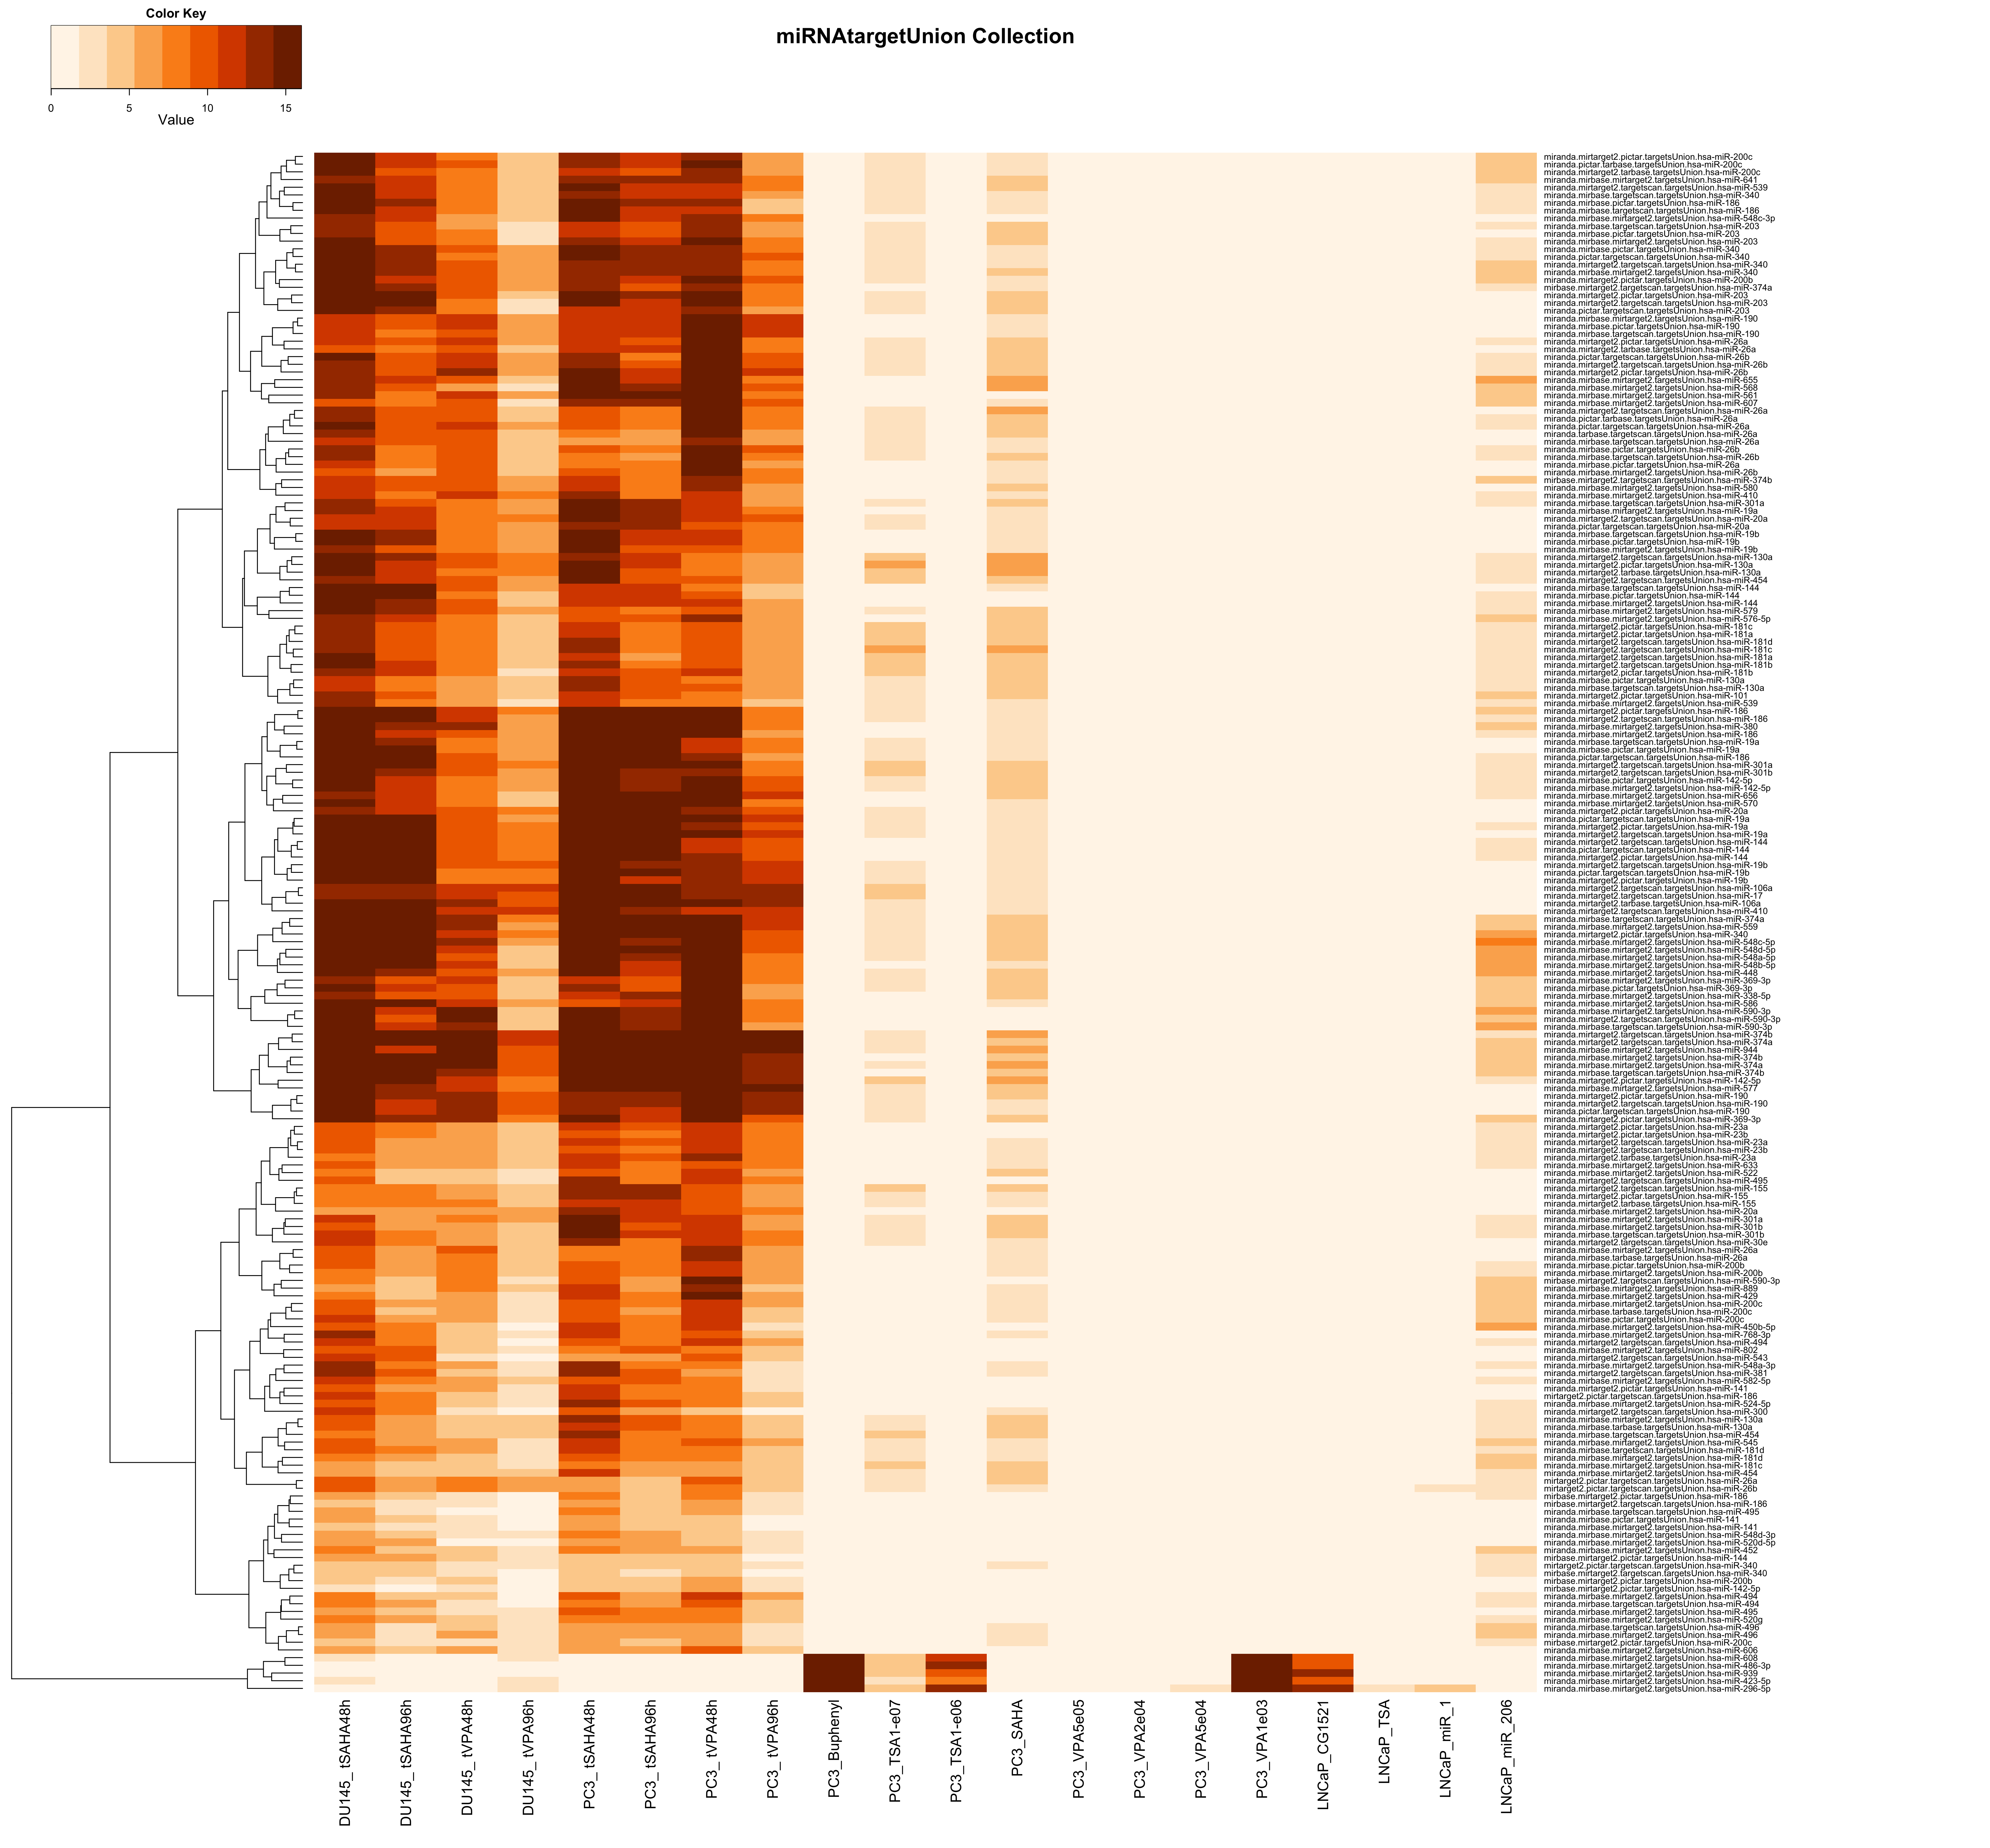
| upMax.miRNAtargetUnion | Analysis of Functional Annotation for up-regulation; heatmap of the top 200 FGS enriched in at least one contrast (FDR < 0.01); the color scale represents the number of decimal digits of the unadjusted p-values from the Wlcoxon rank-sum test; results for upMax.miRNAtargetUnion |
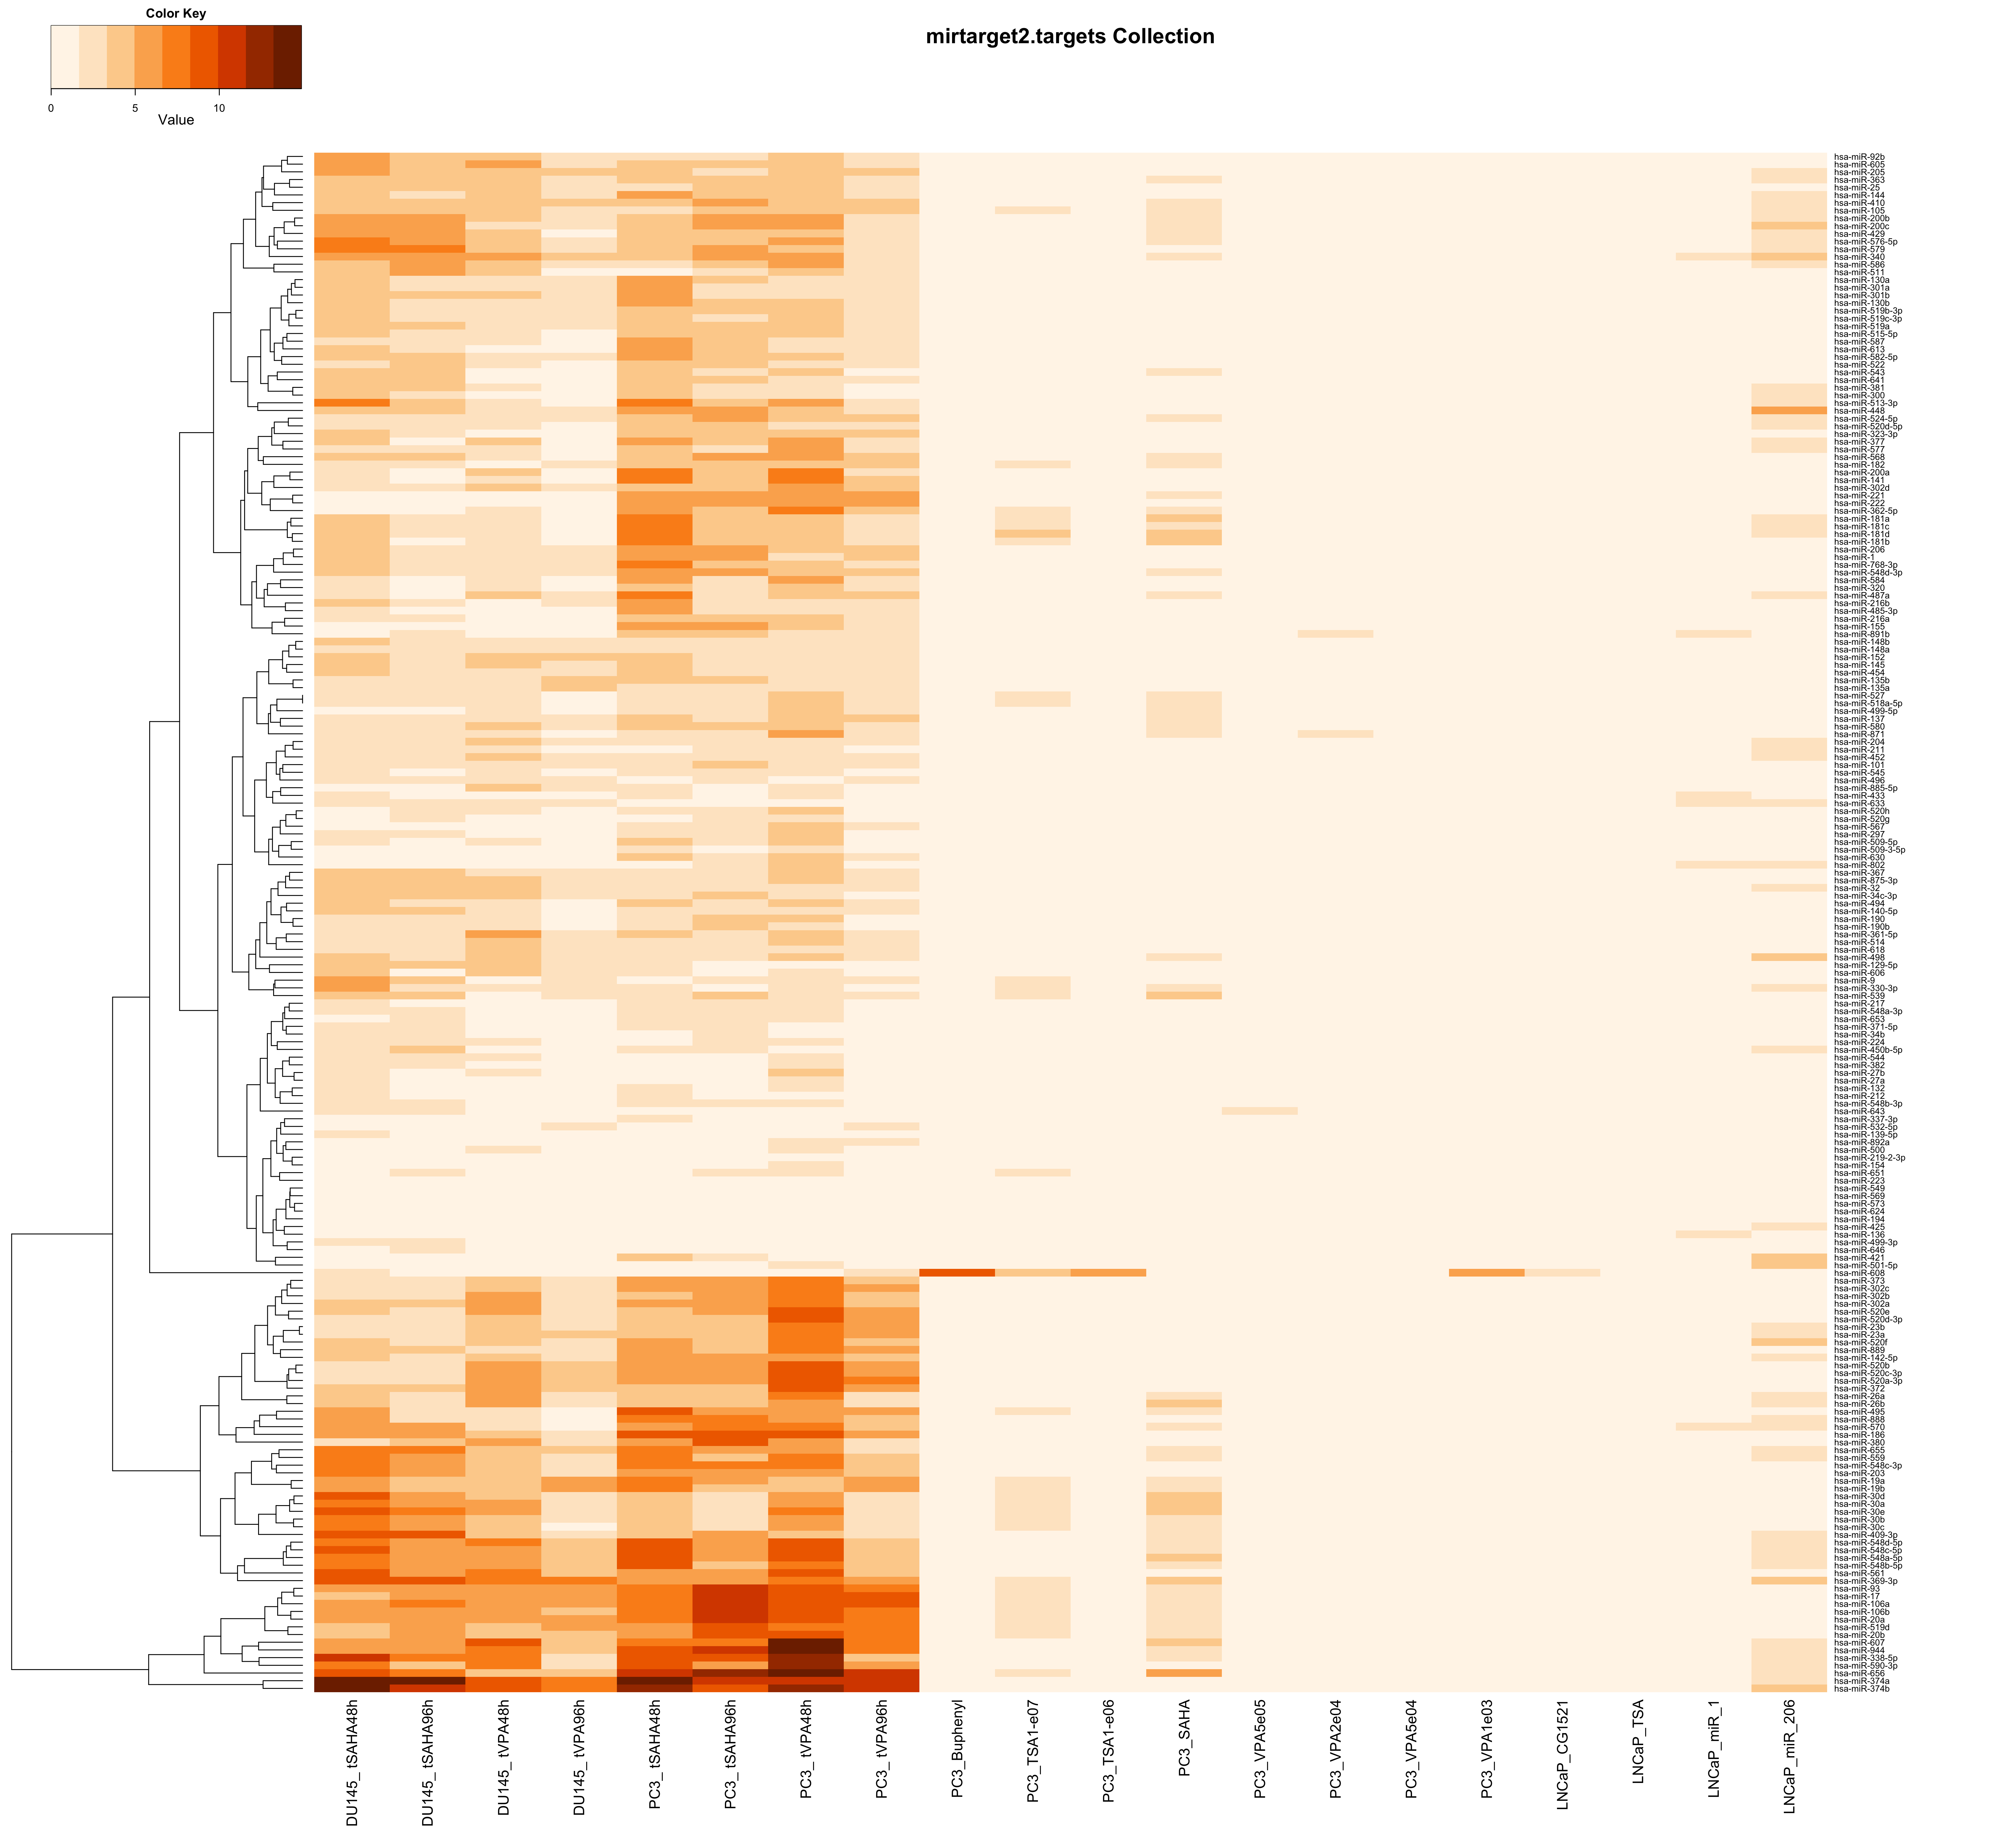
| upMax.mirtarget2.targets | Analysis of Functional Annotation for up-regulation; heatmap of the top 200 FGS enriched in at least one contrast (FDR < 0.01); the color scale represents the number of decimal digits of the unadjusted p-values from the Wlcoxon rank-sum test; results for upMax.mirtarget2.targets |
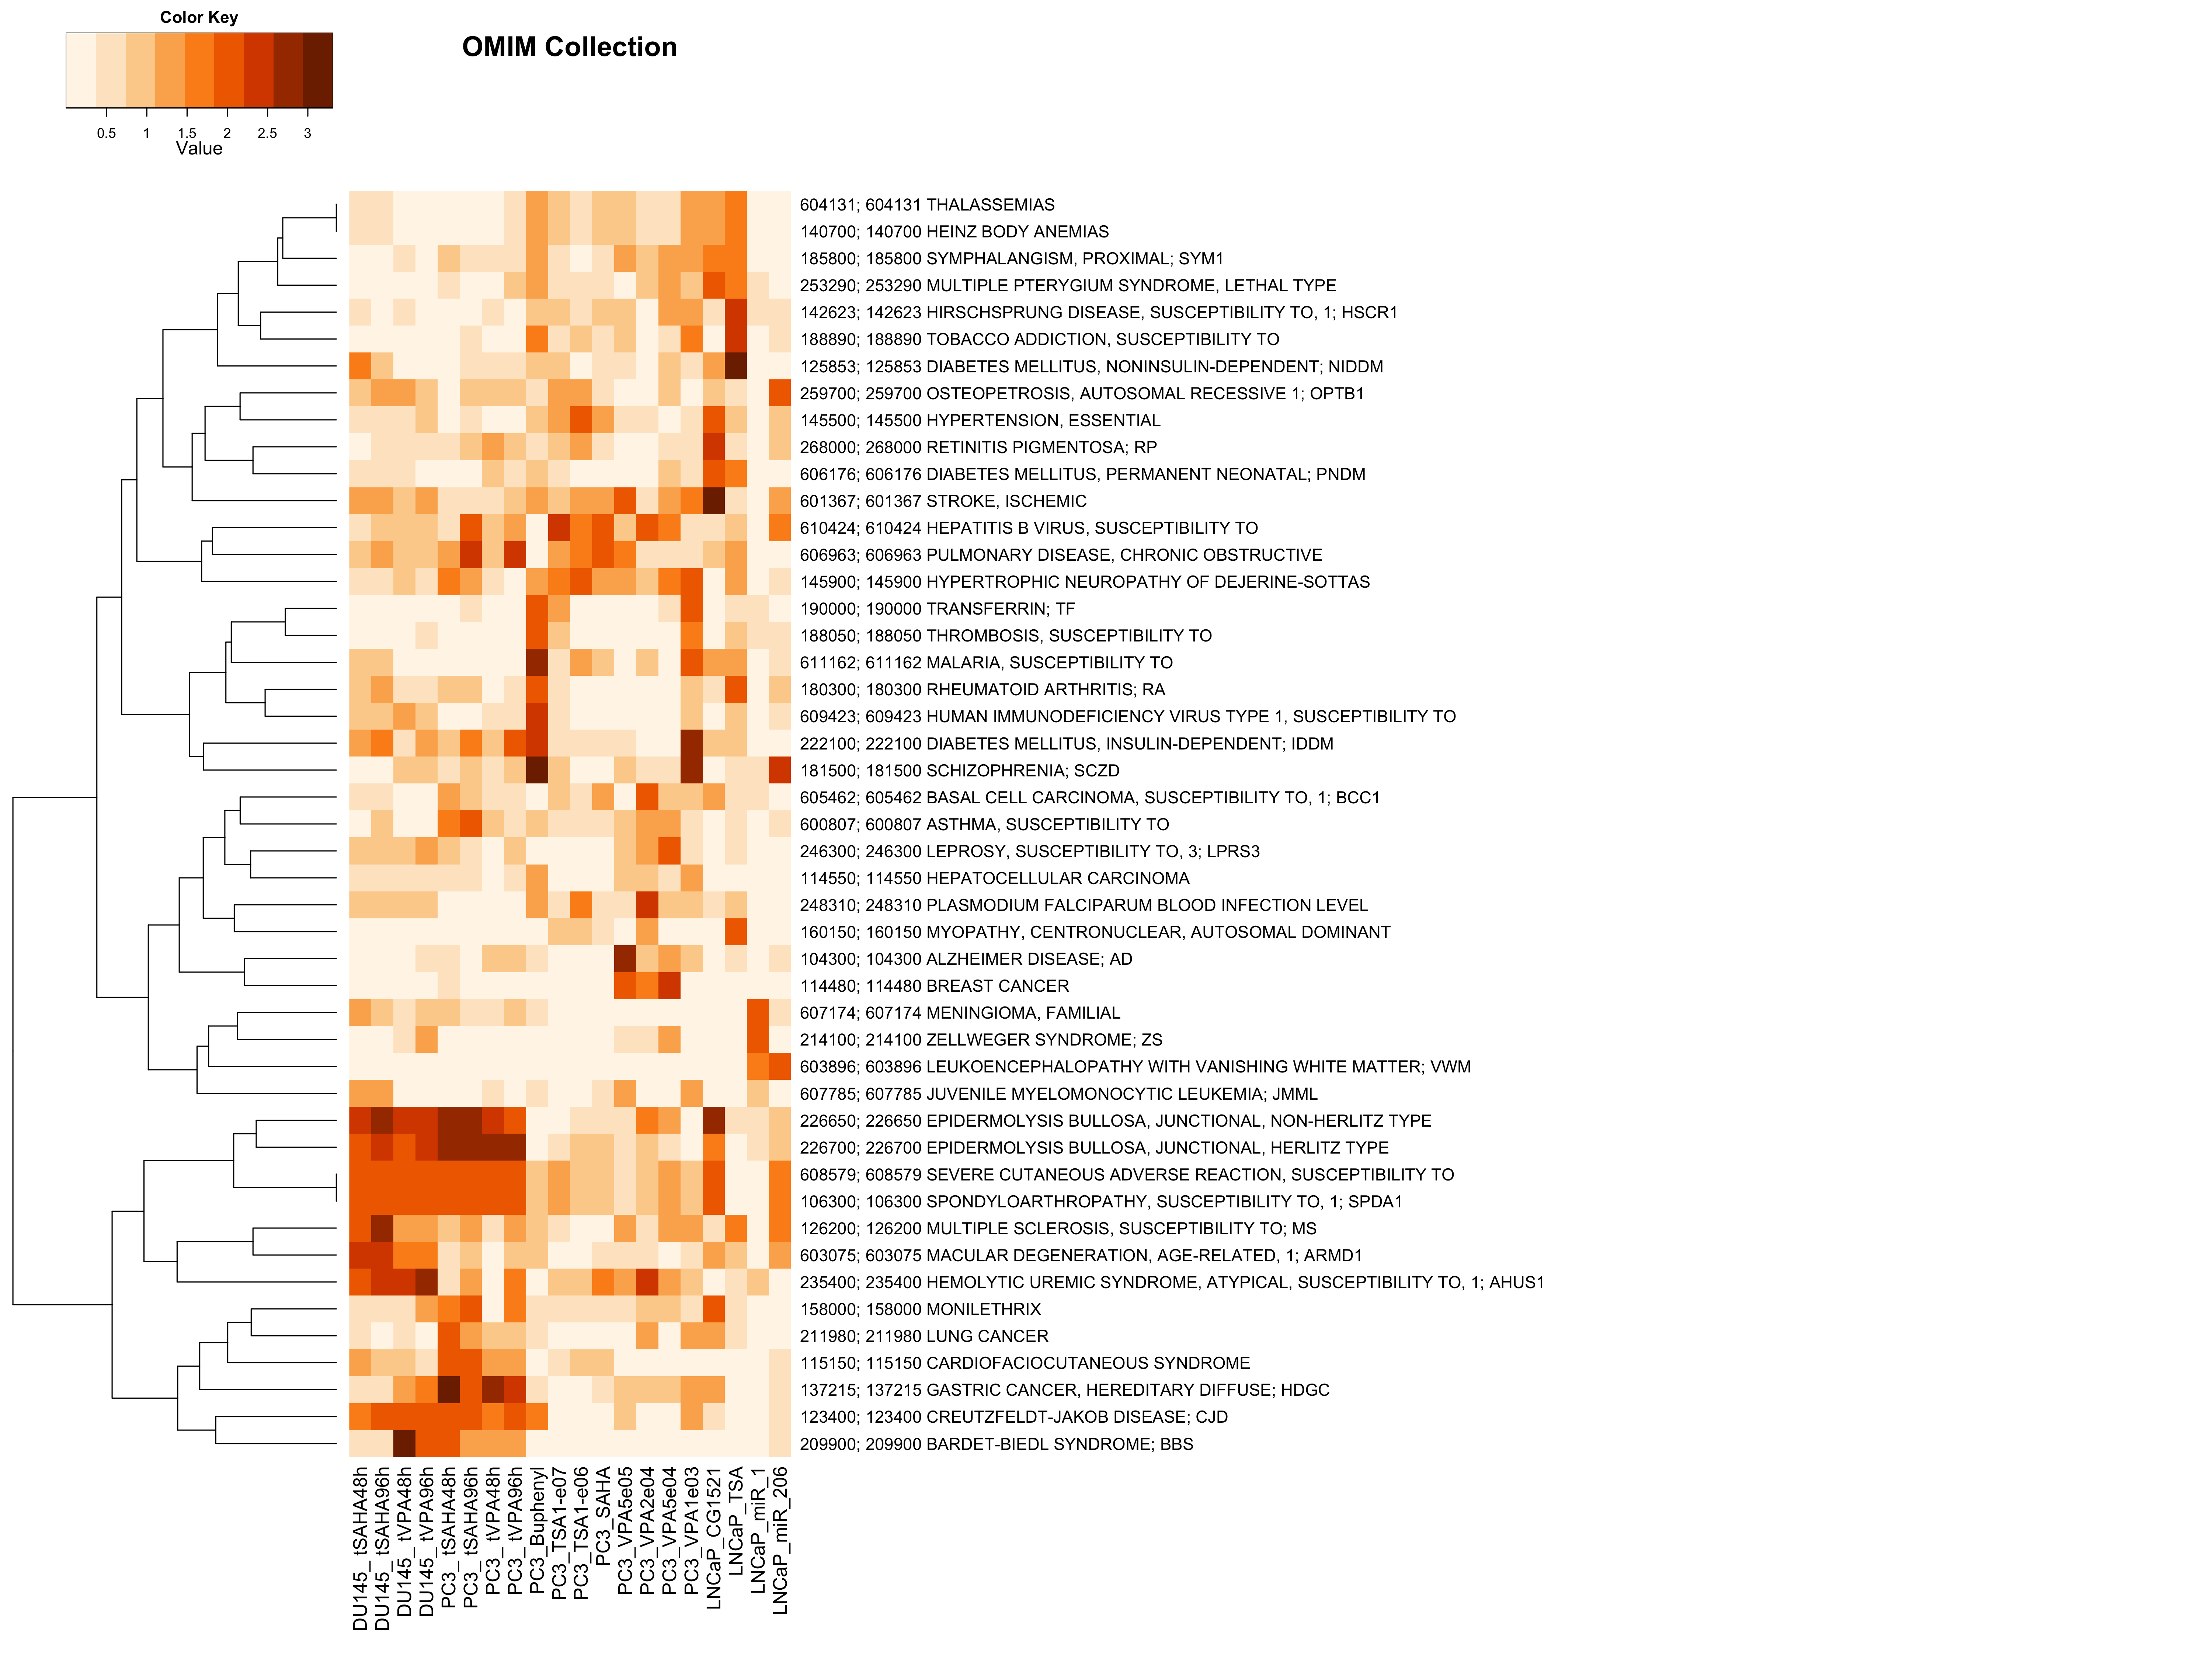
| upMax.OMIM | Analysis of Functional Annotation for up-regulation; heatmap of the top 200 FGS enriched in at least one contrast (FDR < 0.01); the color scale represents the number of decimal digits of the unadjusted p-values from the Wlcoxon rank-sum test; results for upMax.OMIM |
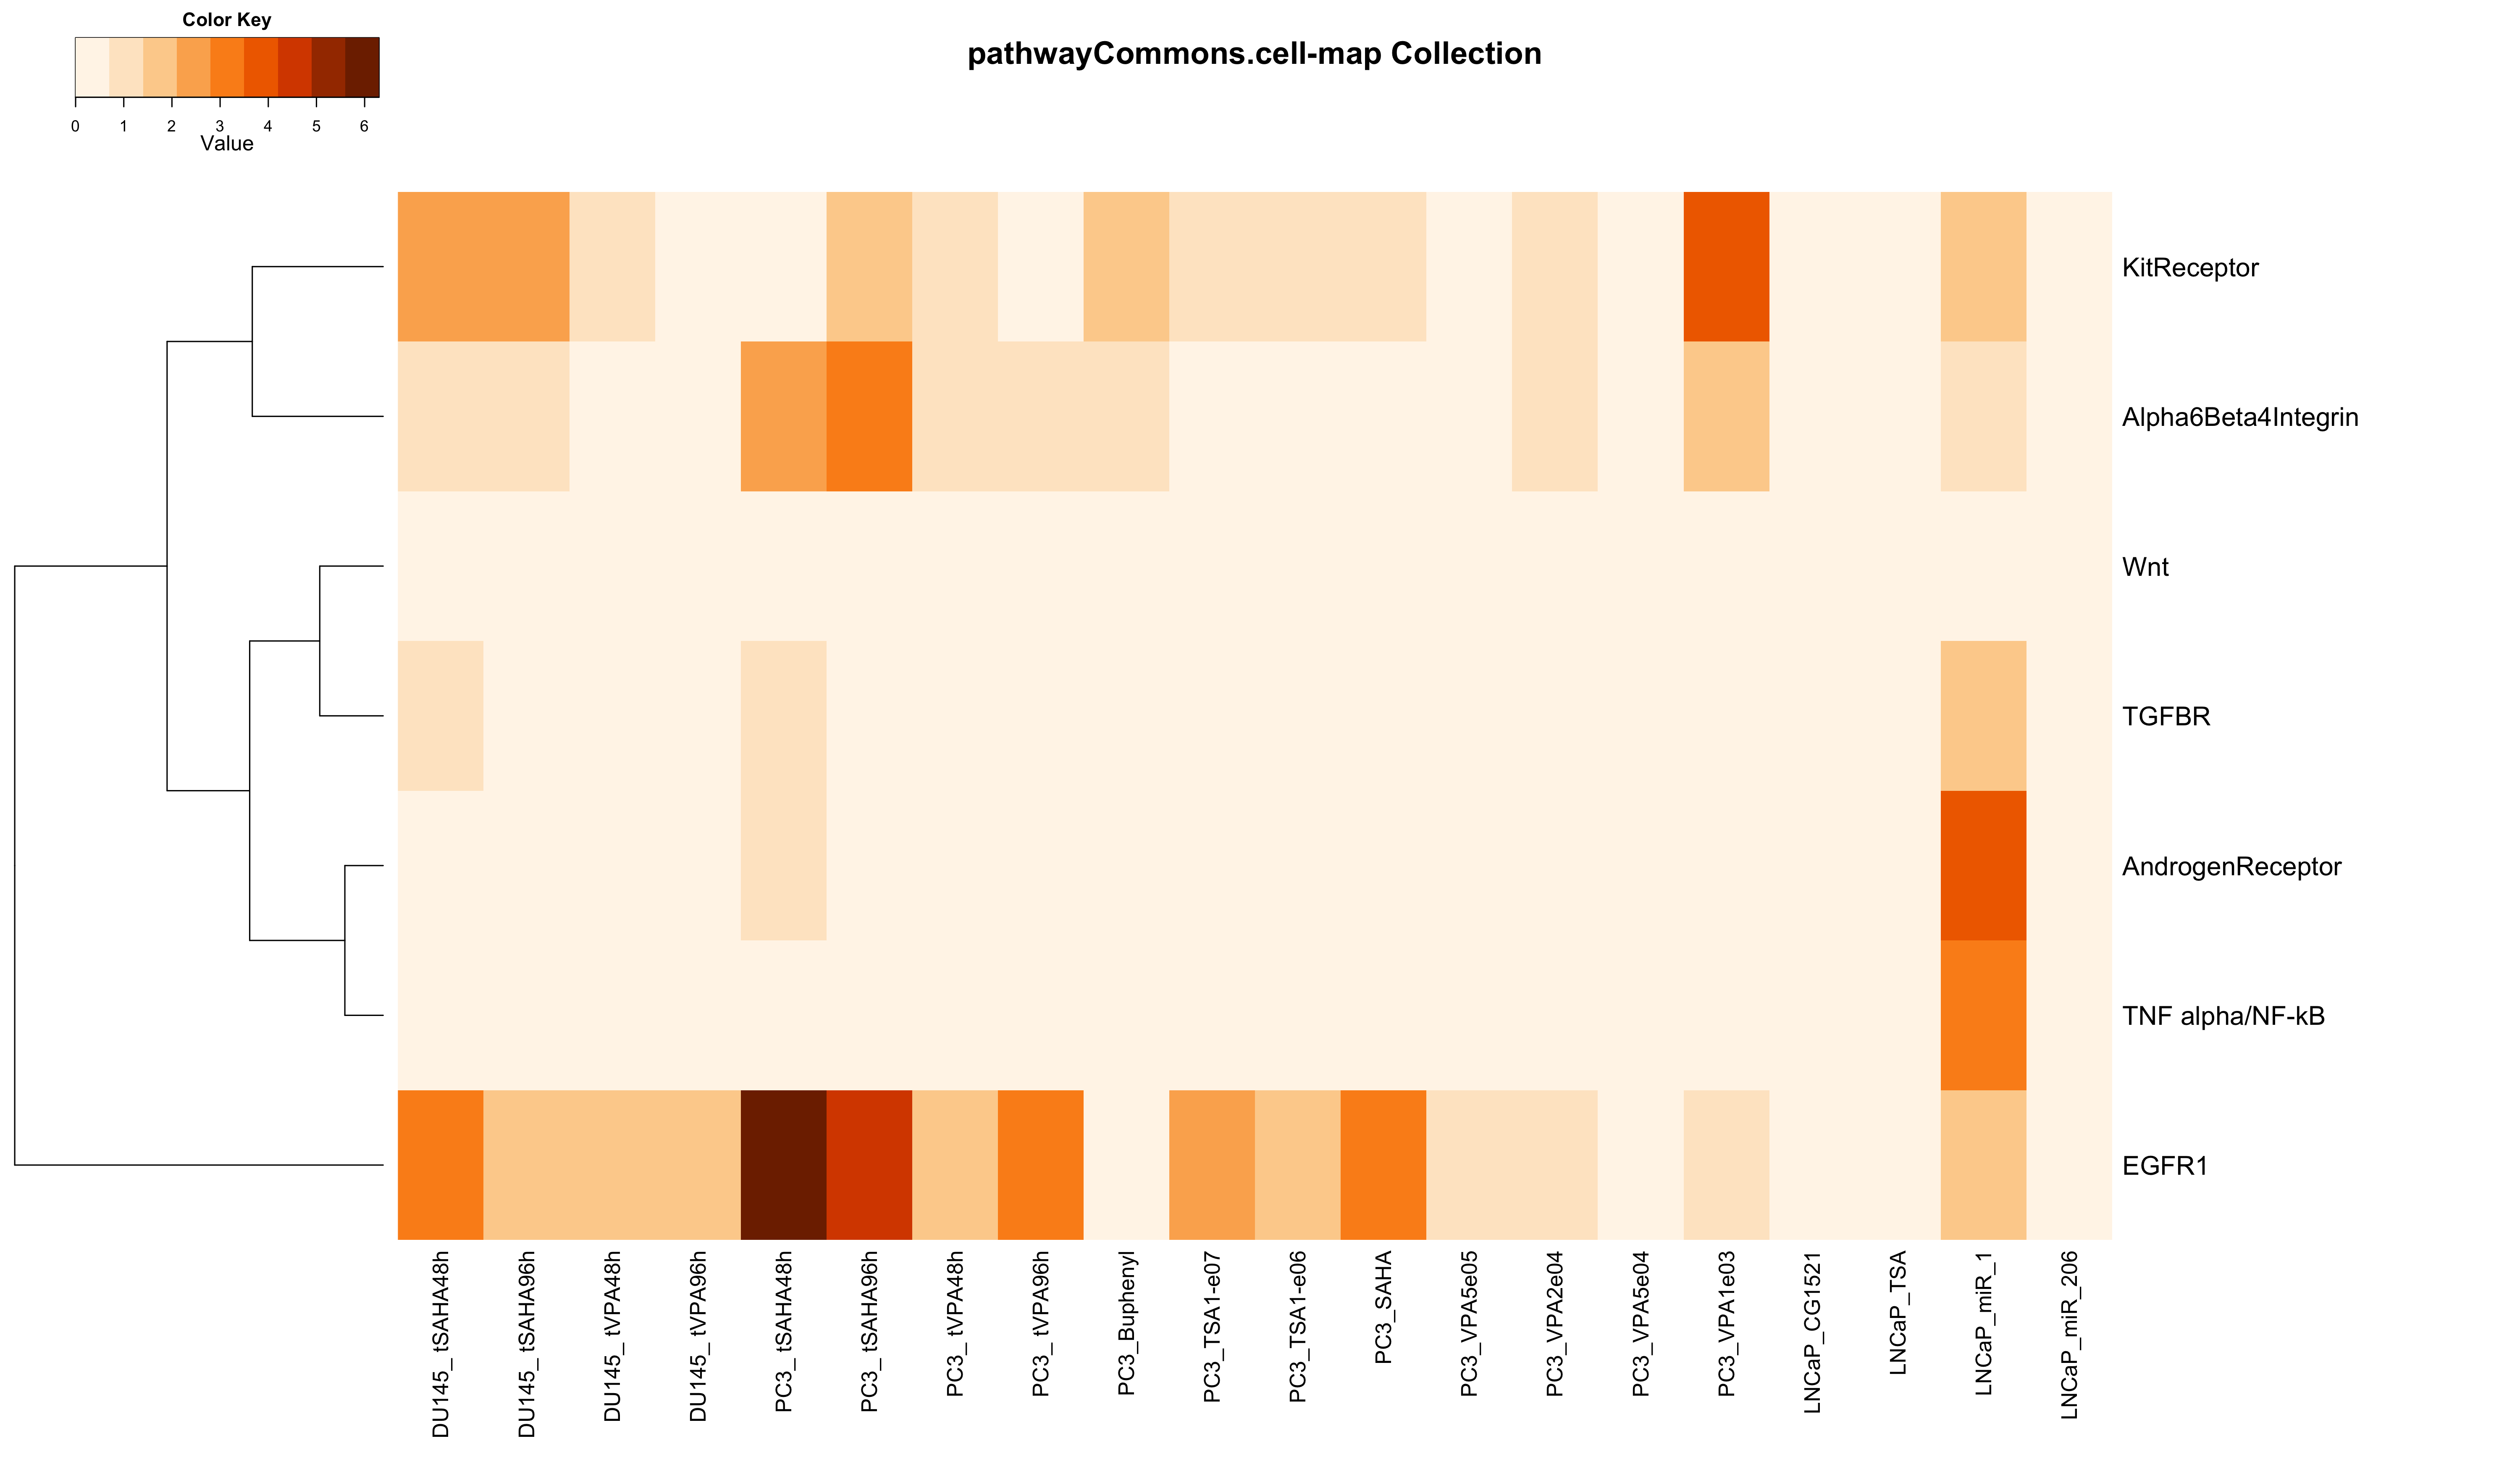
| upMax.pathwayCommons.cell-map | Analysis of Functional Annotation for up-regulation; heatmap of the top 200 FGS enriched in at least one contrast (FDR < 0.01); the color scale represents the number of decimal digits of the unadjusted p-values from the Wlcoxon rank-sum test; results for upMax.pathwayCommons.cell-map |
| upMax.pathwayCommons.humancyc | Analysis of Functional Annotation for up-regulation; heatmap of the top 200 FGS enriched in at least one contrast (FDR < 0.01); the color scale represents the number of decimal digits of the unadjusted p-values from the Wlcoxon rank-sum test; results for upMax.pathwayCommons.humancyc |
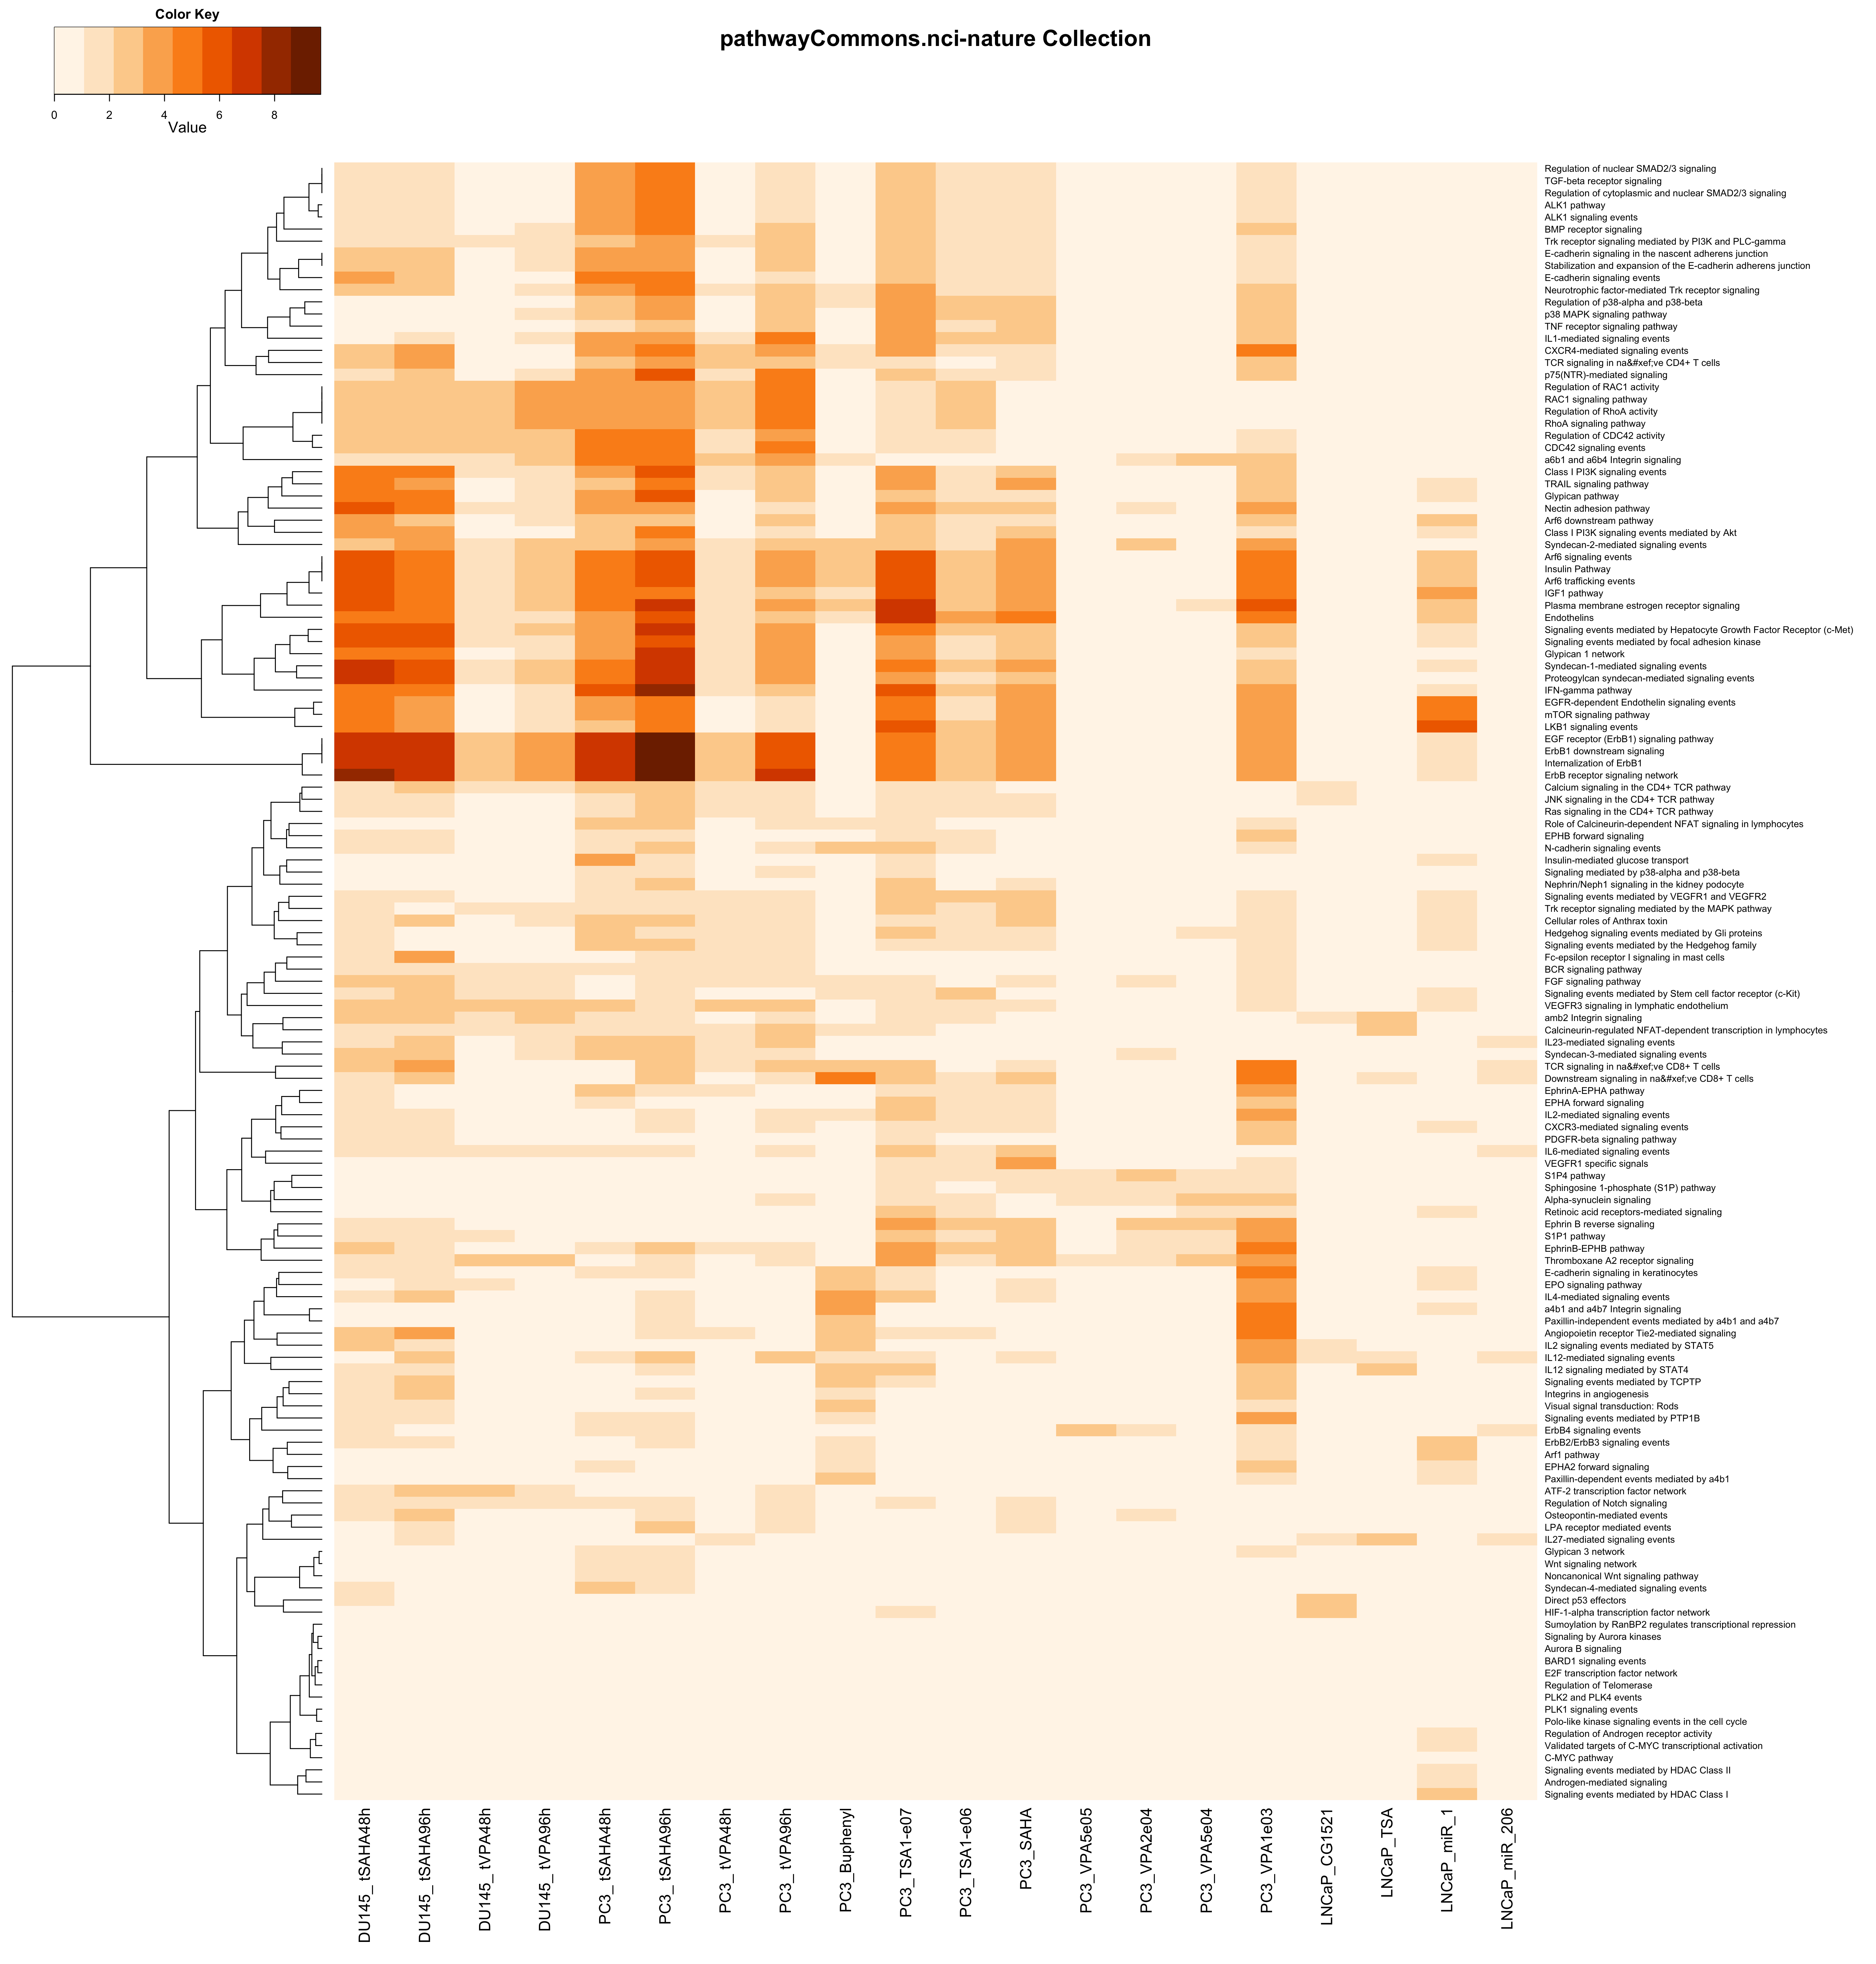
| upMax.pathwayCommons.nci-nature | Analysis of Functional Annotation for up-regulation; heatmap of the top 200 FGS enriched in at least one contrast (FDR < 0.01); the color scale represents the number of decimal digits of the unadjusted p-values from the Wlcoxon rank-sum test; results for upMax.pathwayCommons.nci-nature |
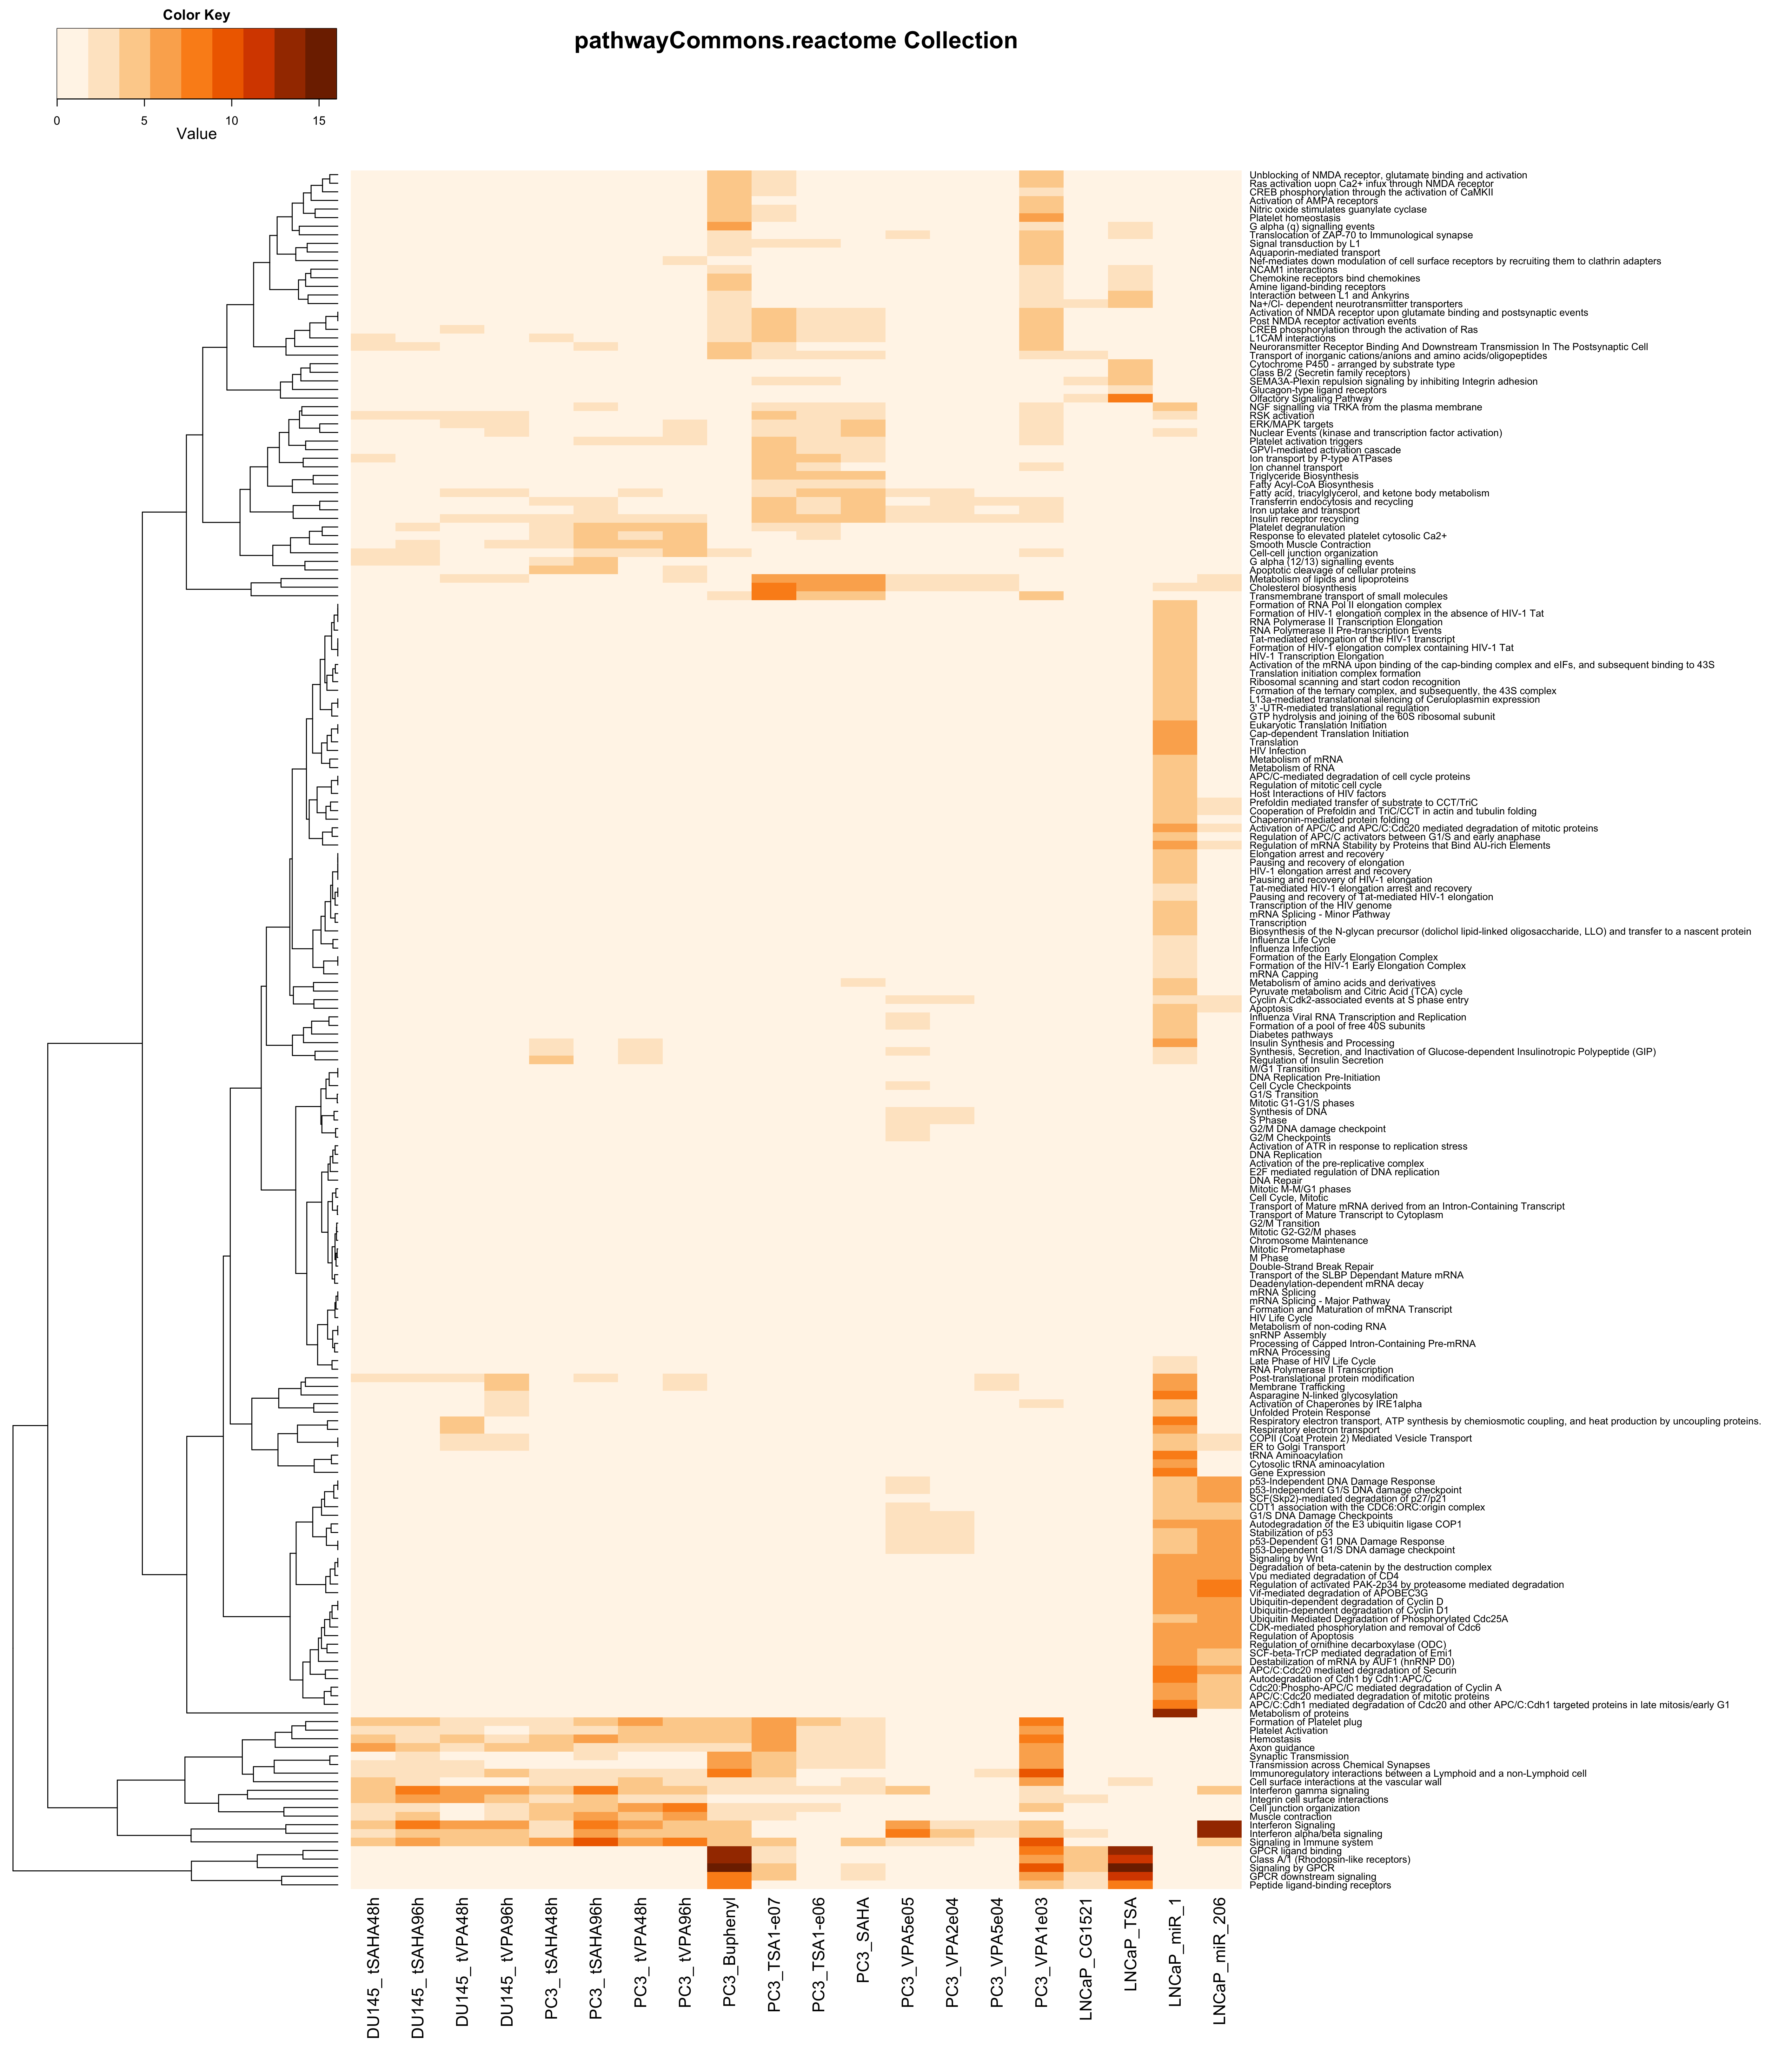
| upMax.pathwayCommons.reactome | Analysis of Functional Annotation for up-regulation; heatmap of the top 200 FGS enriched in at least one contrast (FDR < 0.01); the color scale represents the number of decimal digits of the unadjusted p-values from the Wlcoxon rank-sum test; results for upMax.pathwayCommons.reactome |
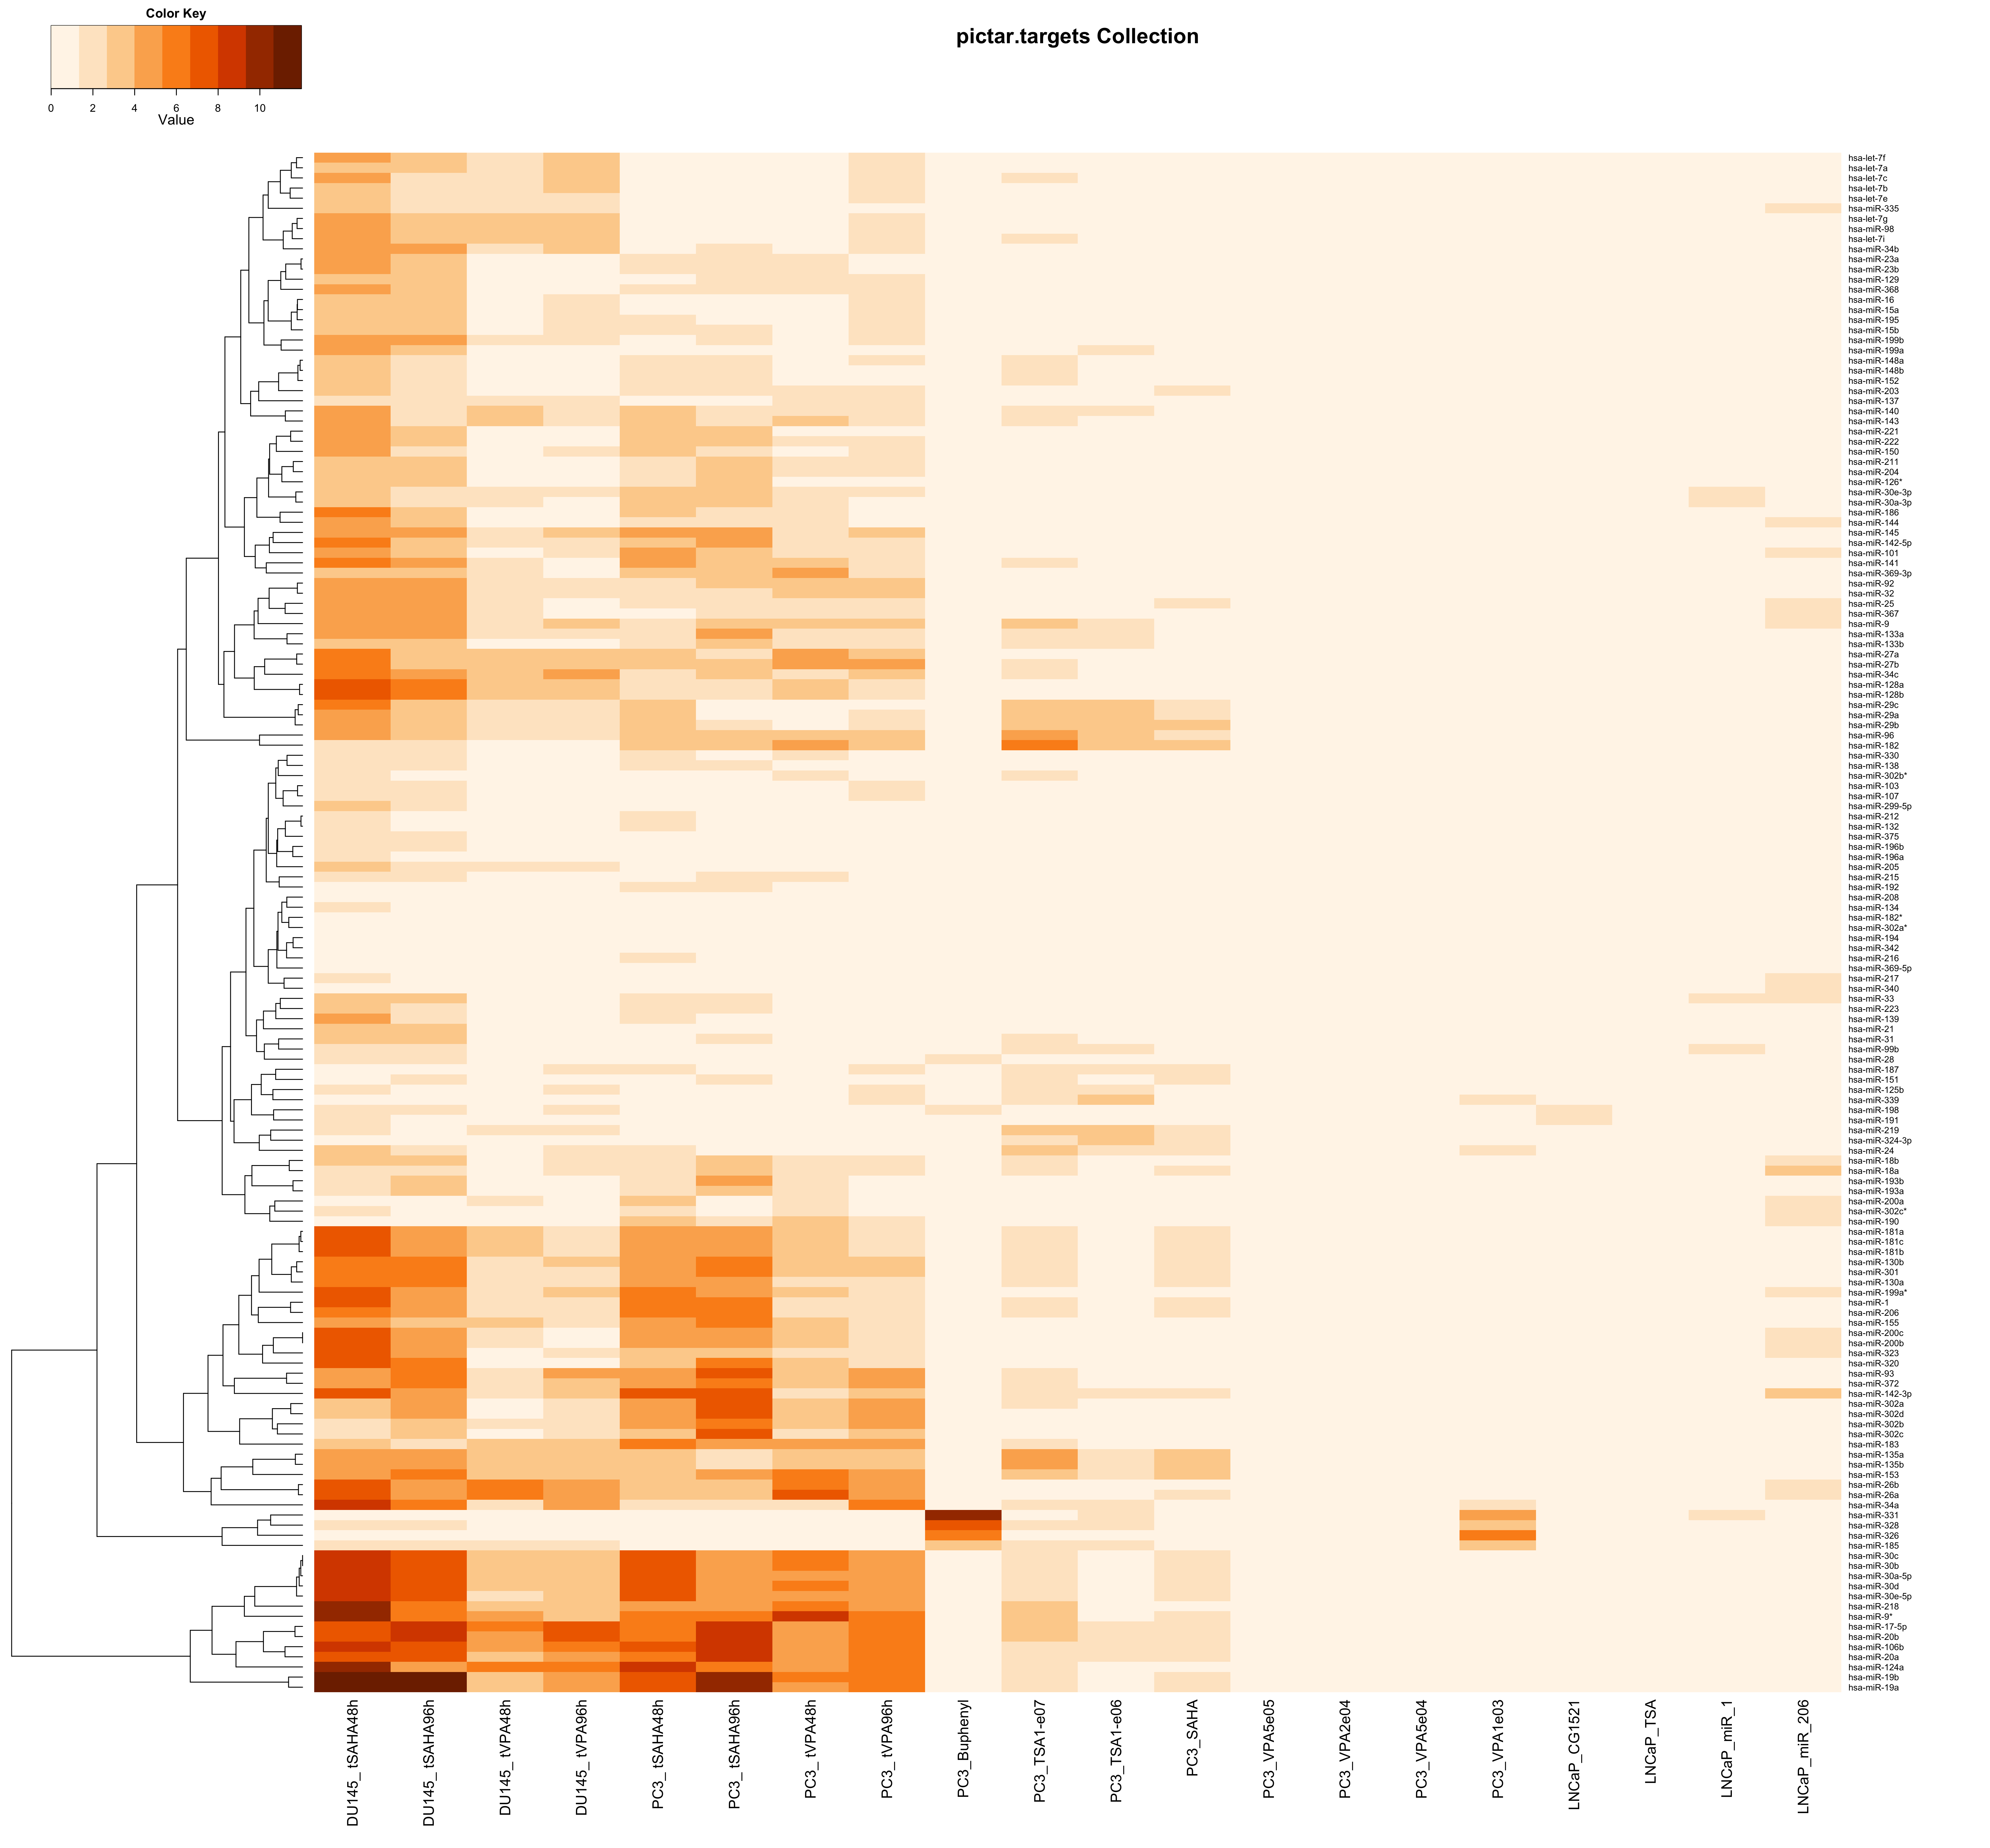
| upMax.pictar.targets | Analysis of Functional Annotation for up-regulation; heatmap of the top 200 FGS enriched in at least one contrast (FDR < 0.01); the color scale represents the number of decimal digits of the unadjusted p-values from the Wlcoxon rank-sum test; results for upMax.pictar.targets |
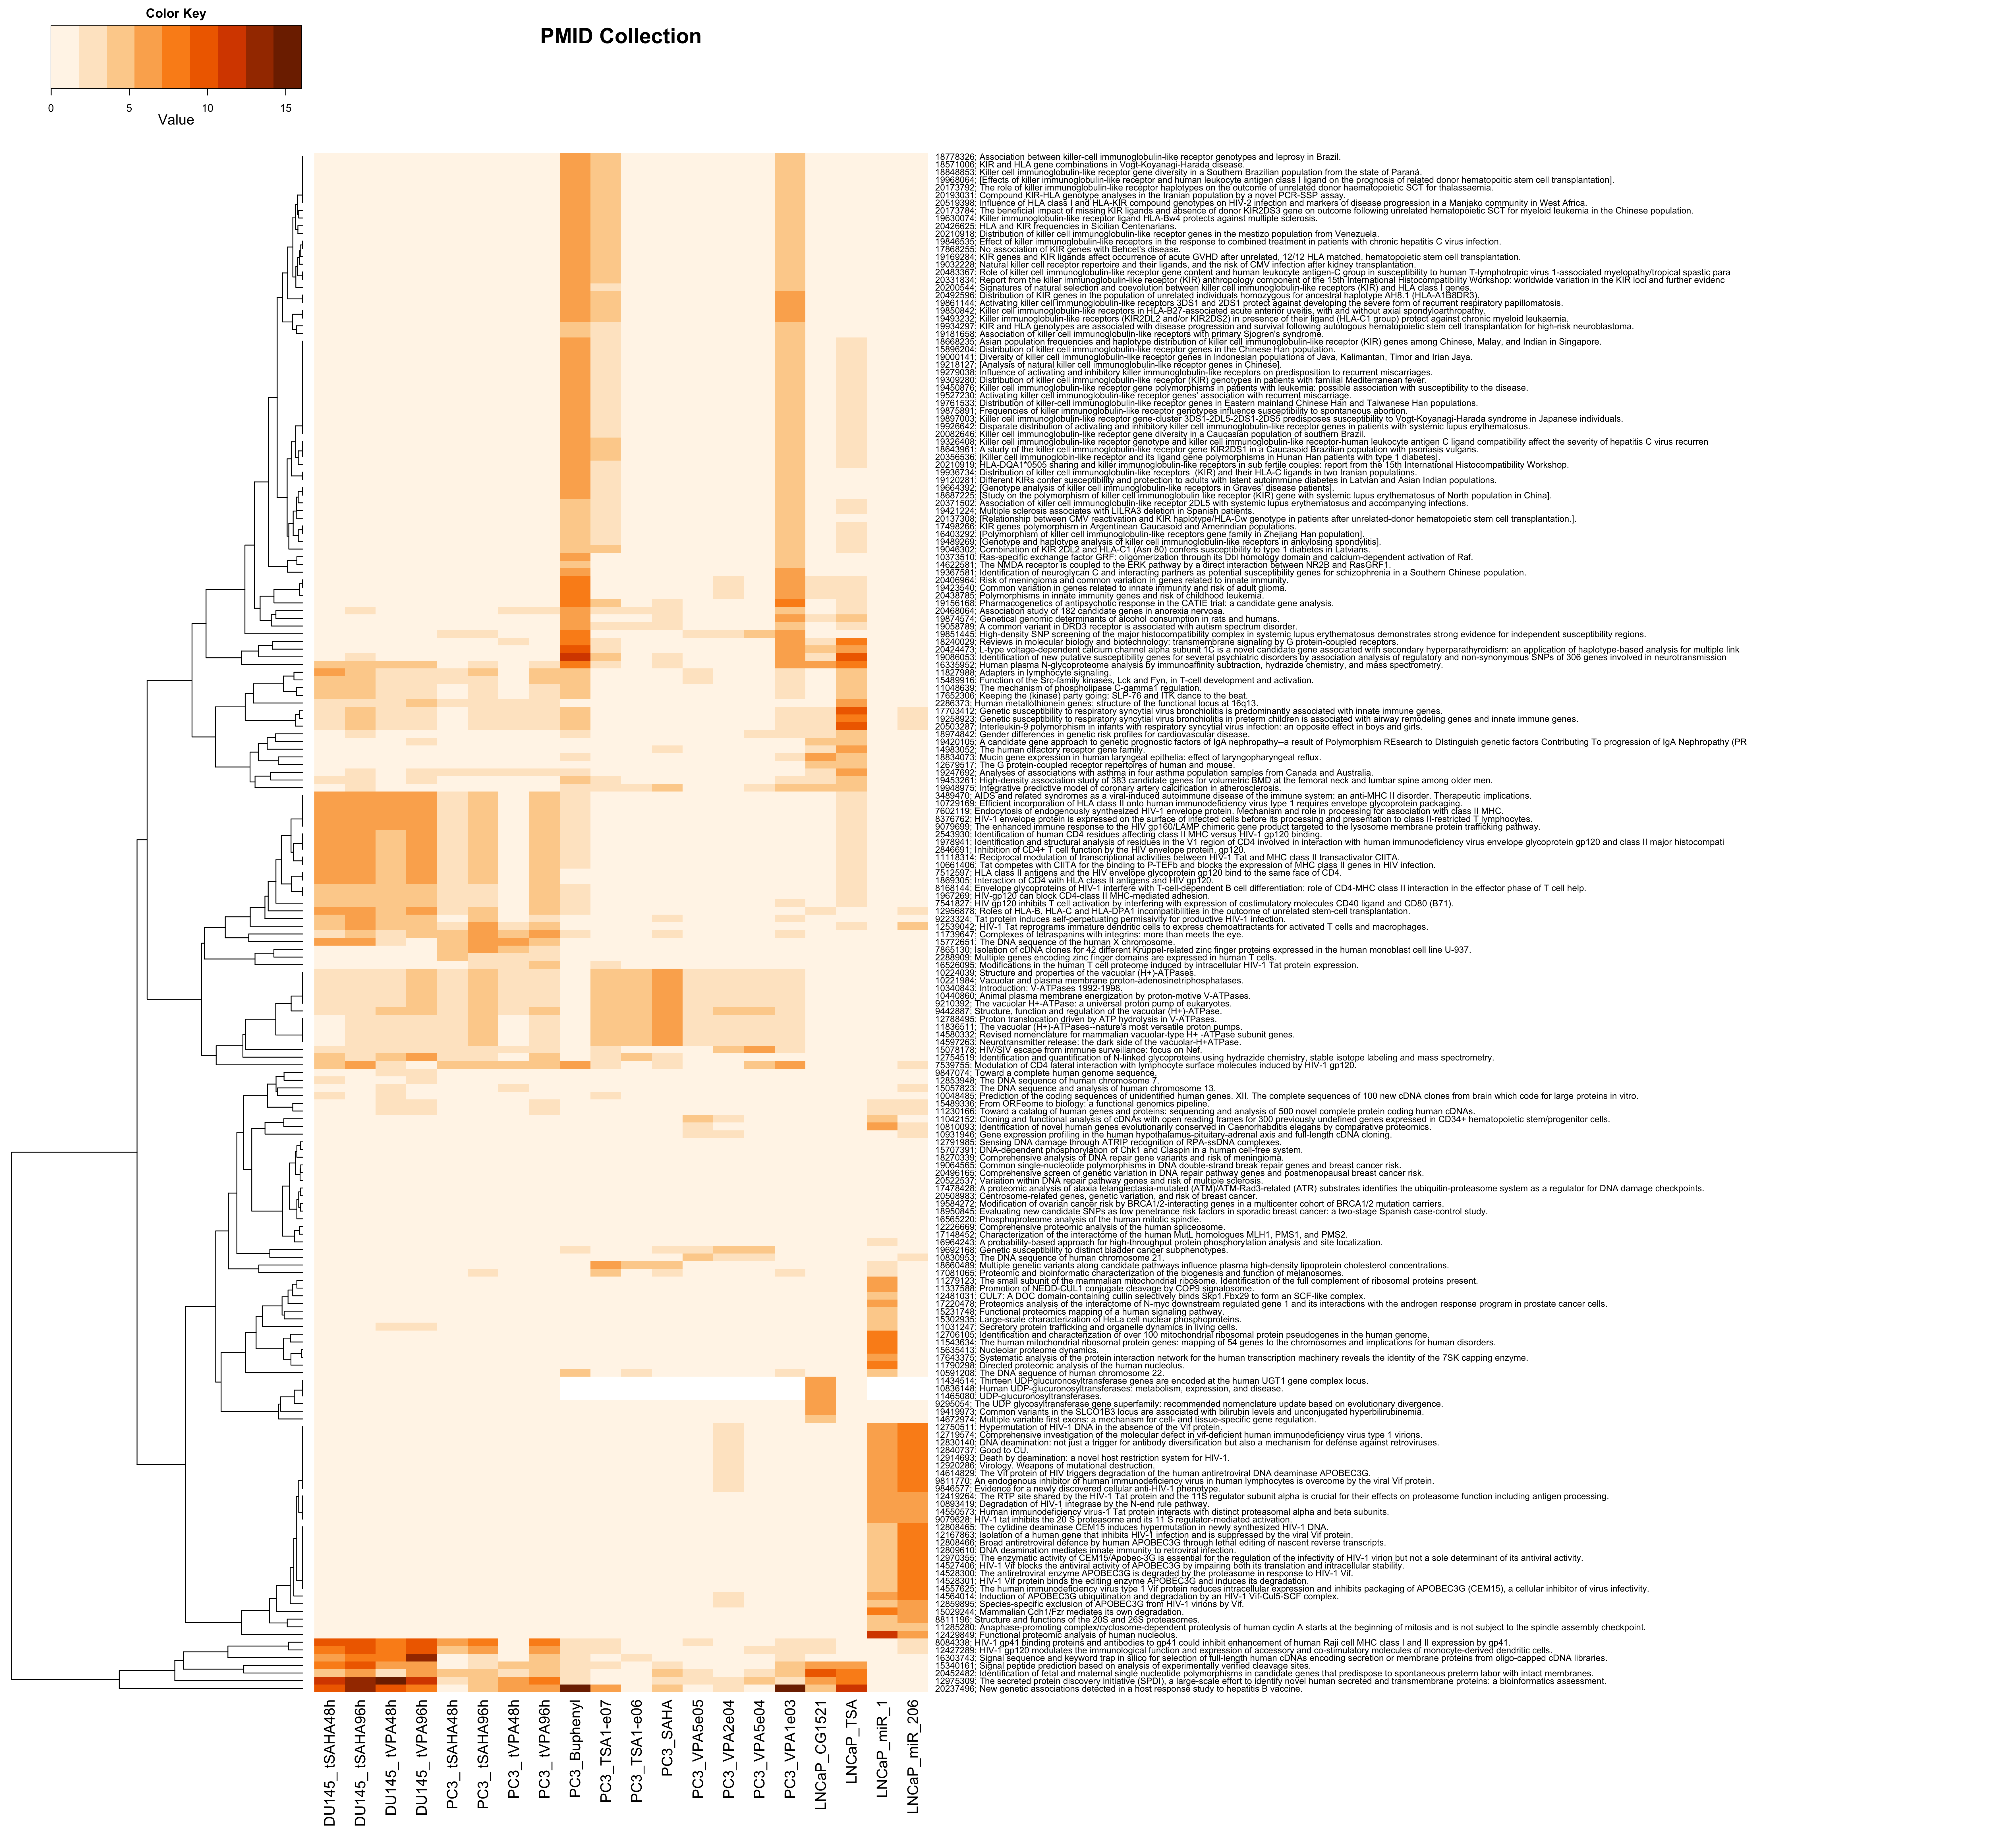
| upMax.PMID | Analysis of Functional Annotation for up-regulation; heatmap of the top 200 FGS enriched in at least one contrast (FDR < 0.01); the color scale represents the number of decimal digits of the unadjusted p-values from the Wlcoxon rank-sum test; results for upMax.PMID |
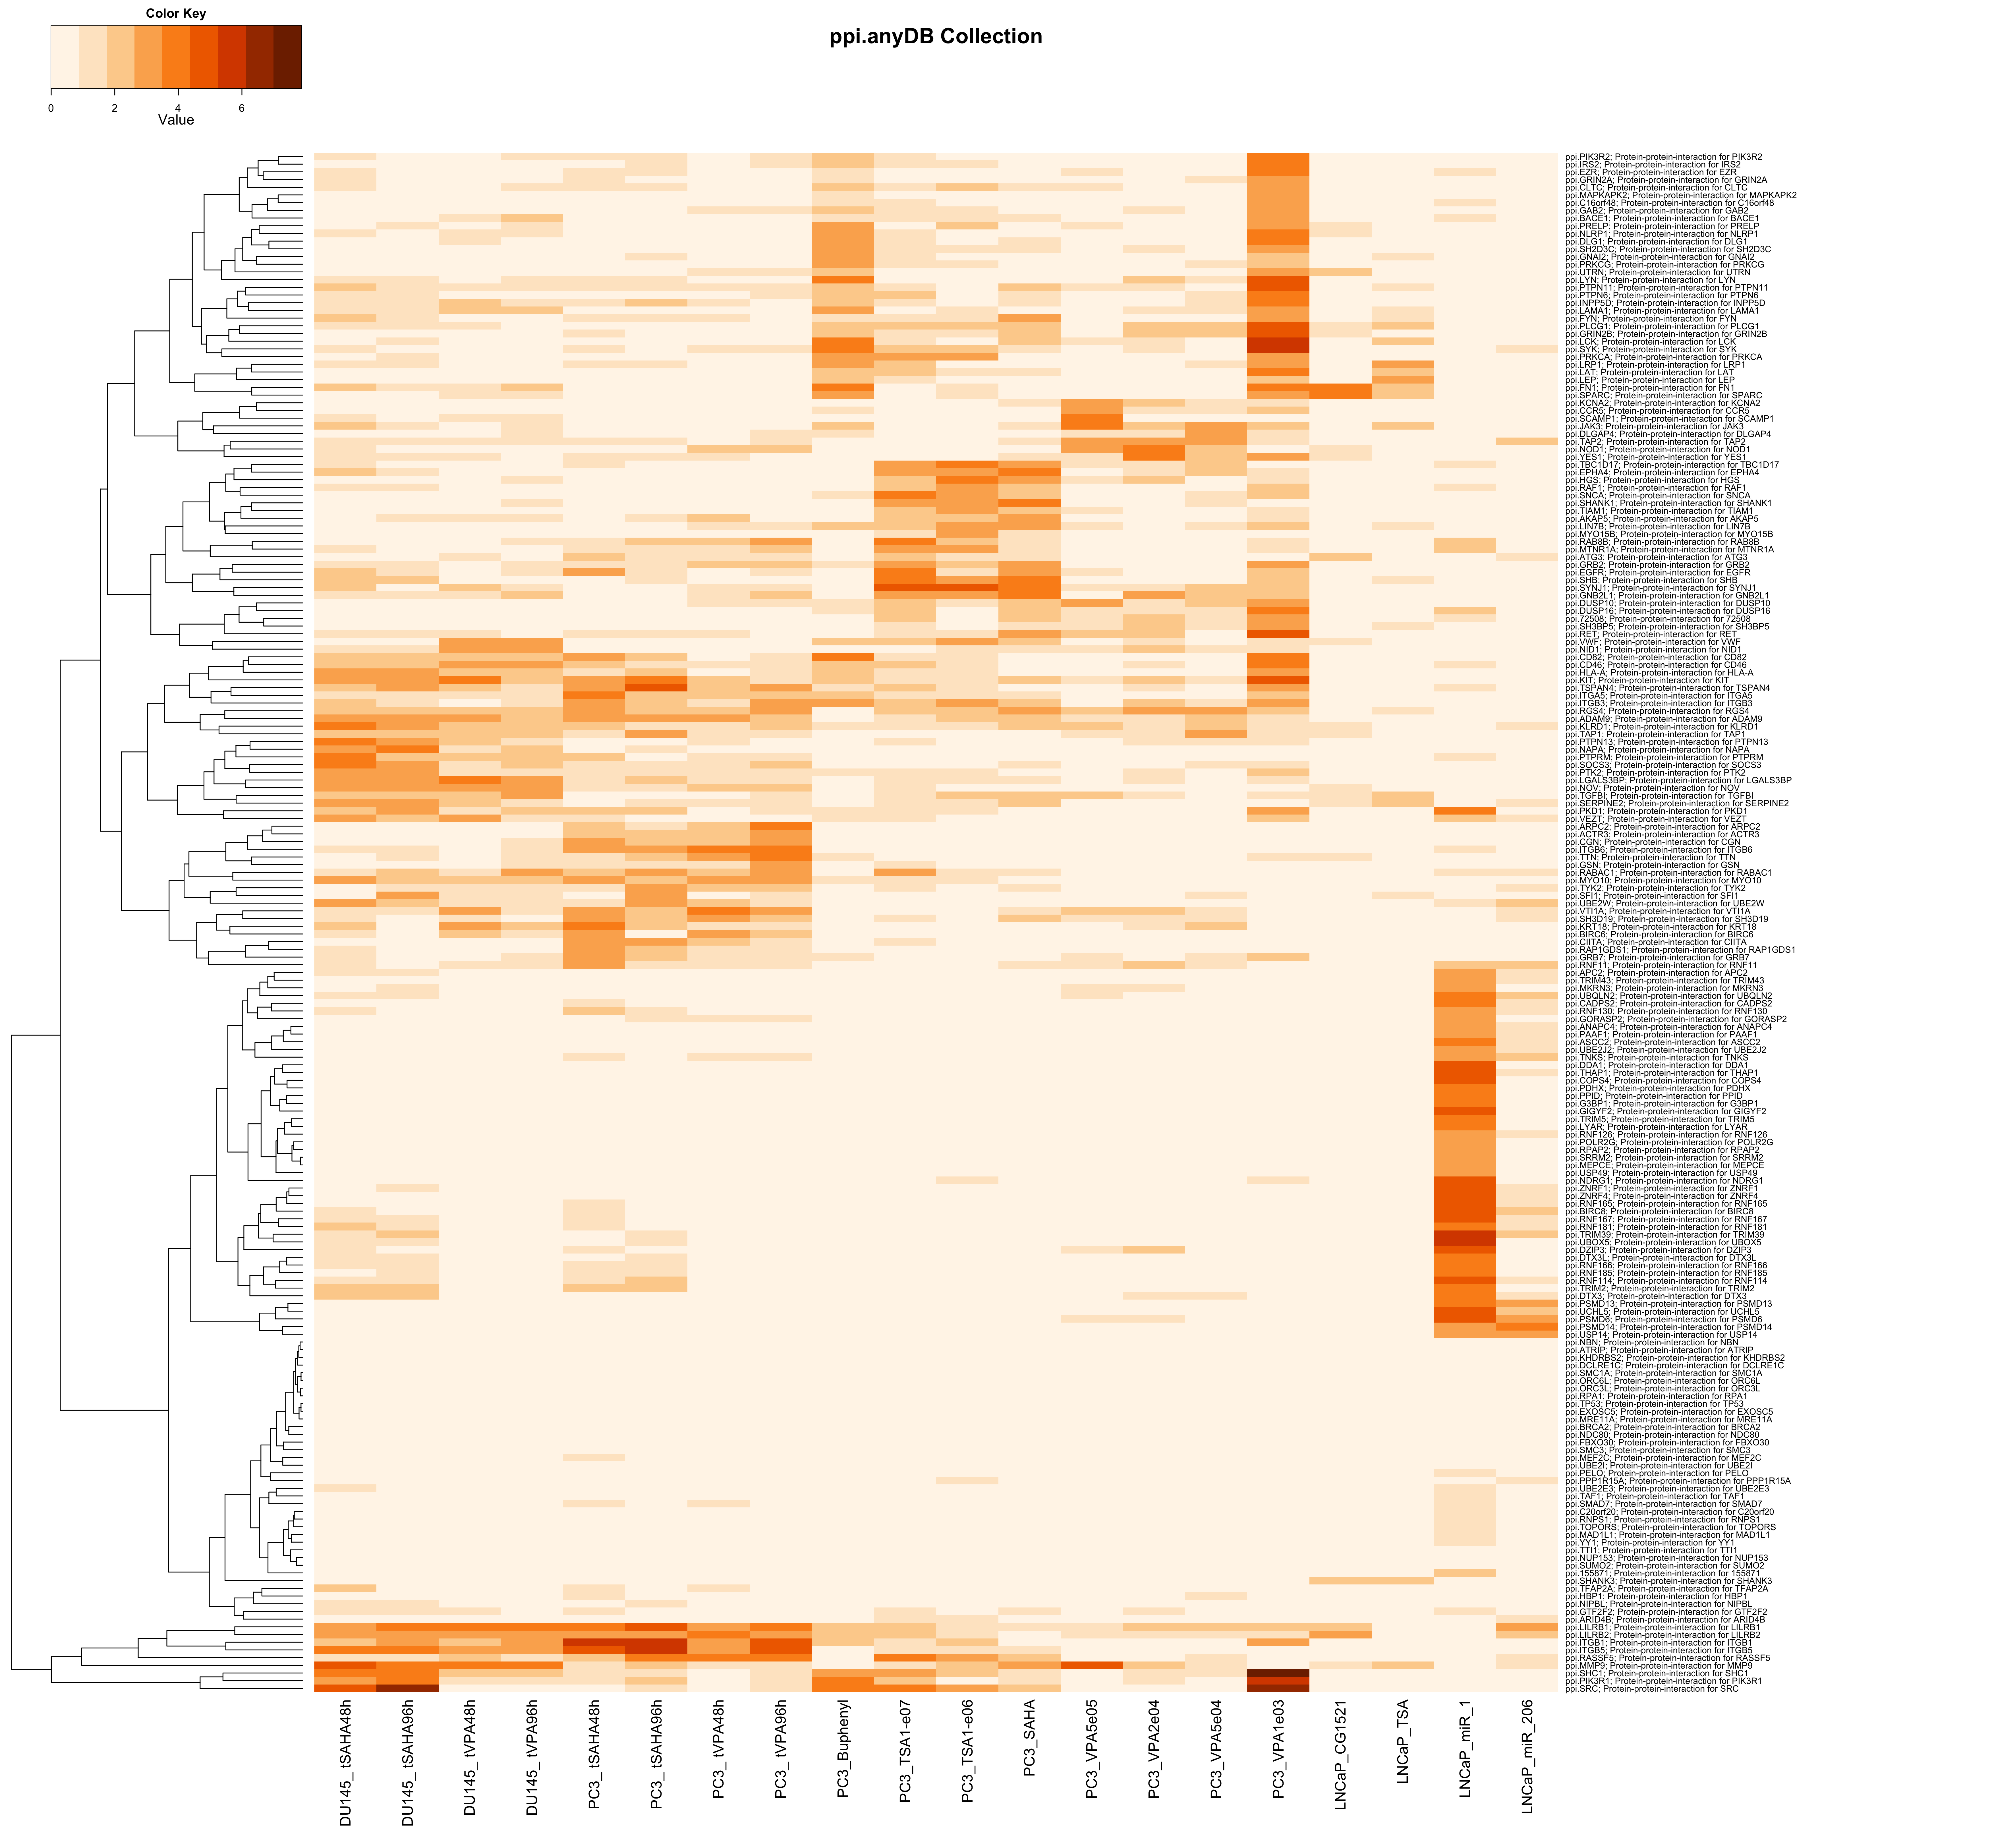
| upMax.ppi.anyDB | Analysis of Functional Annotation for up-regulation; heatmap of the top 200 FGS enriched in at least one contrast (FDR < 0.01); the color scale represents the number of decimal digits of the unadjusted p-values from the Wlcoxon rank-sum test; results for upMax.ppi.anyDB |
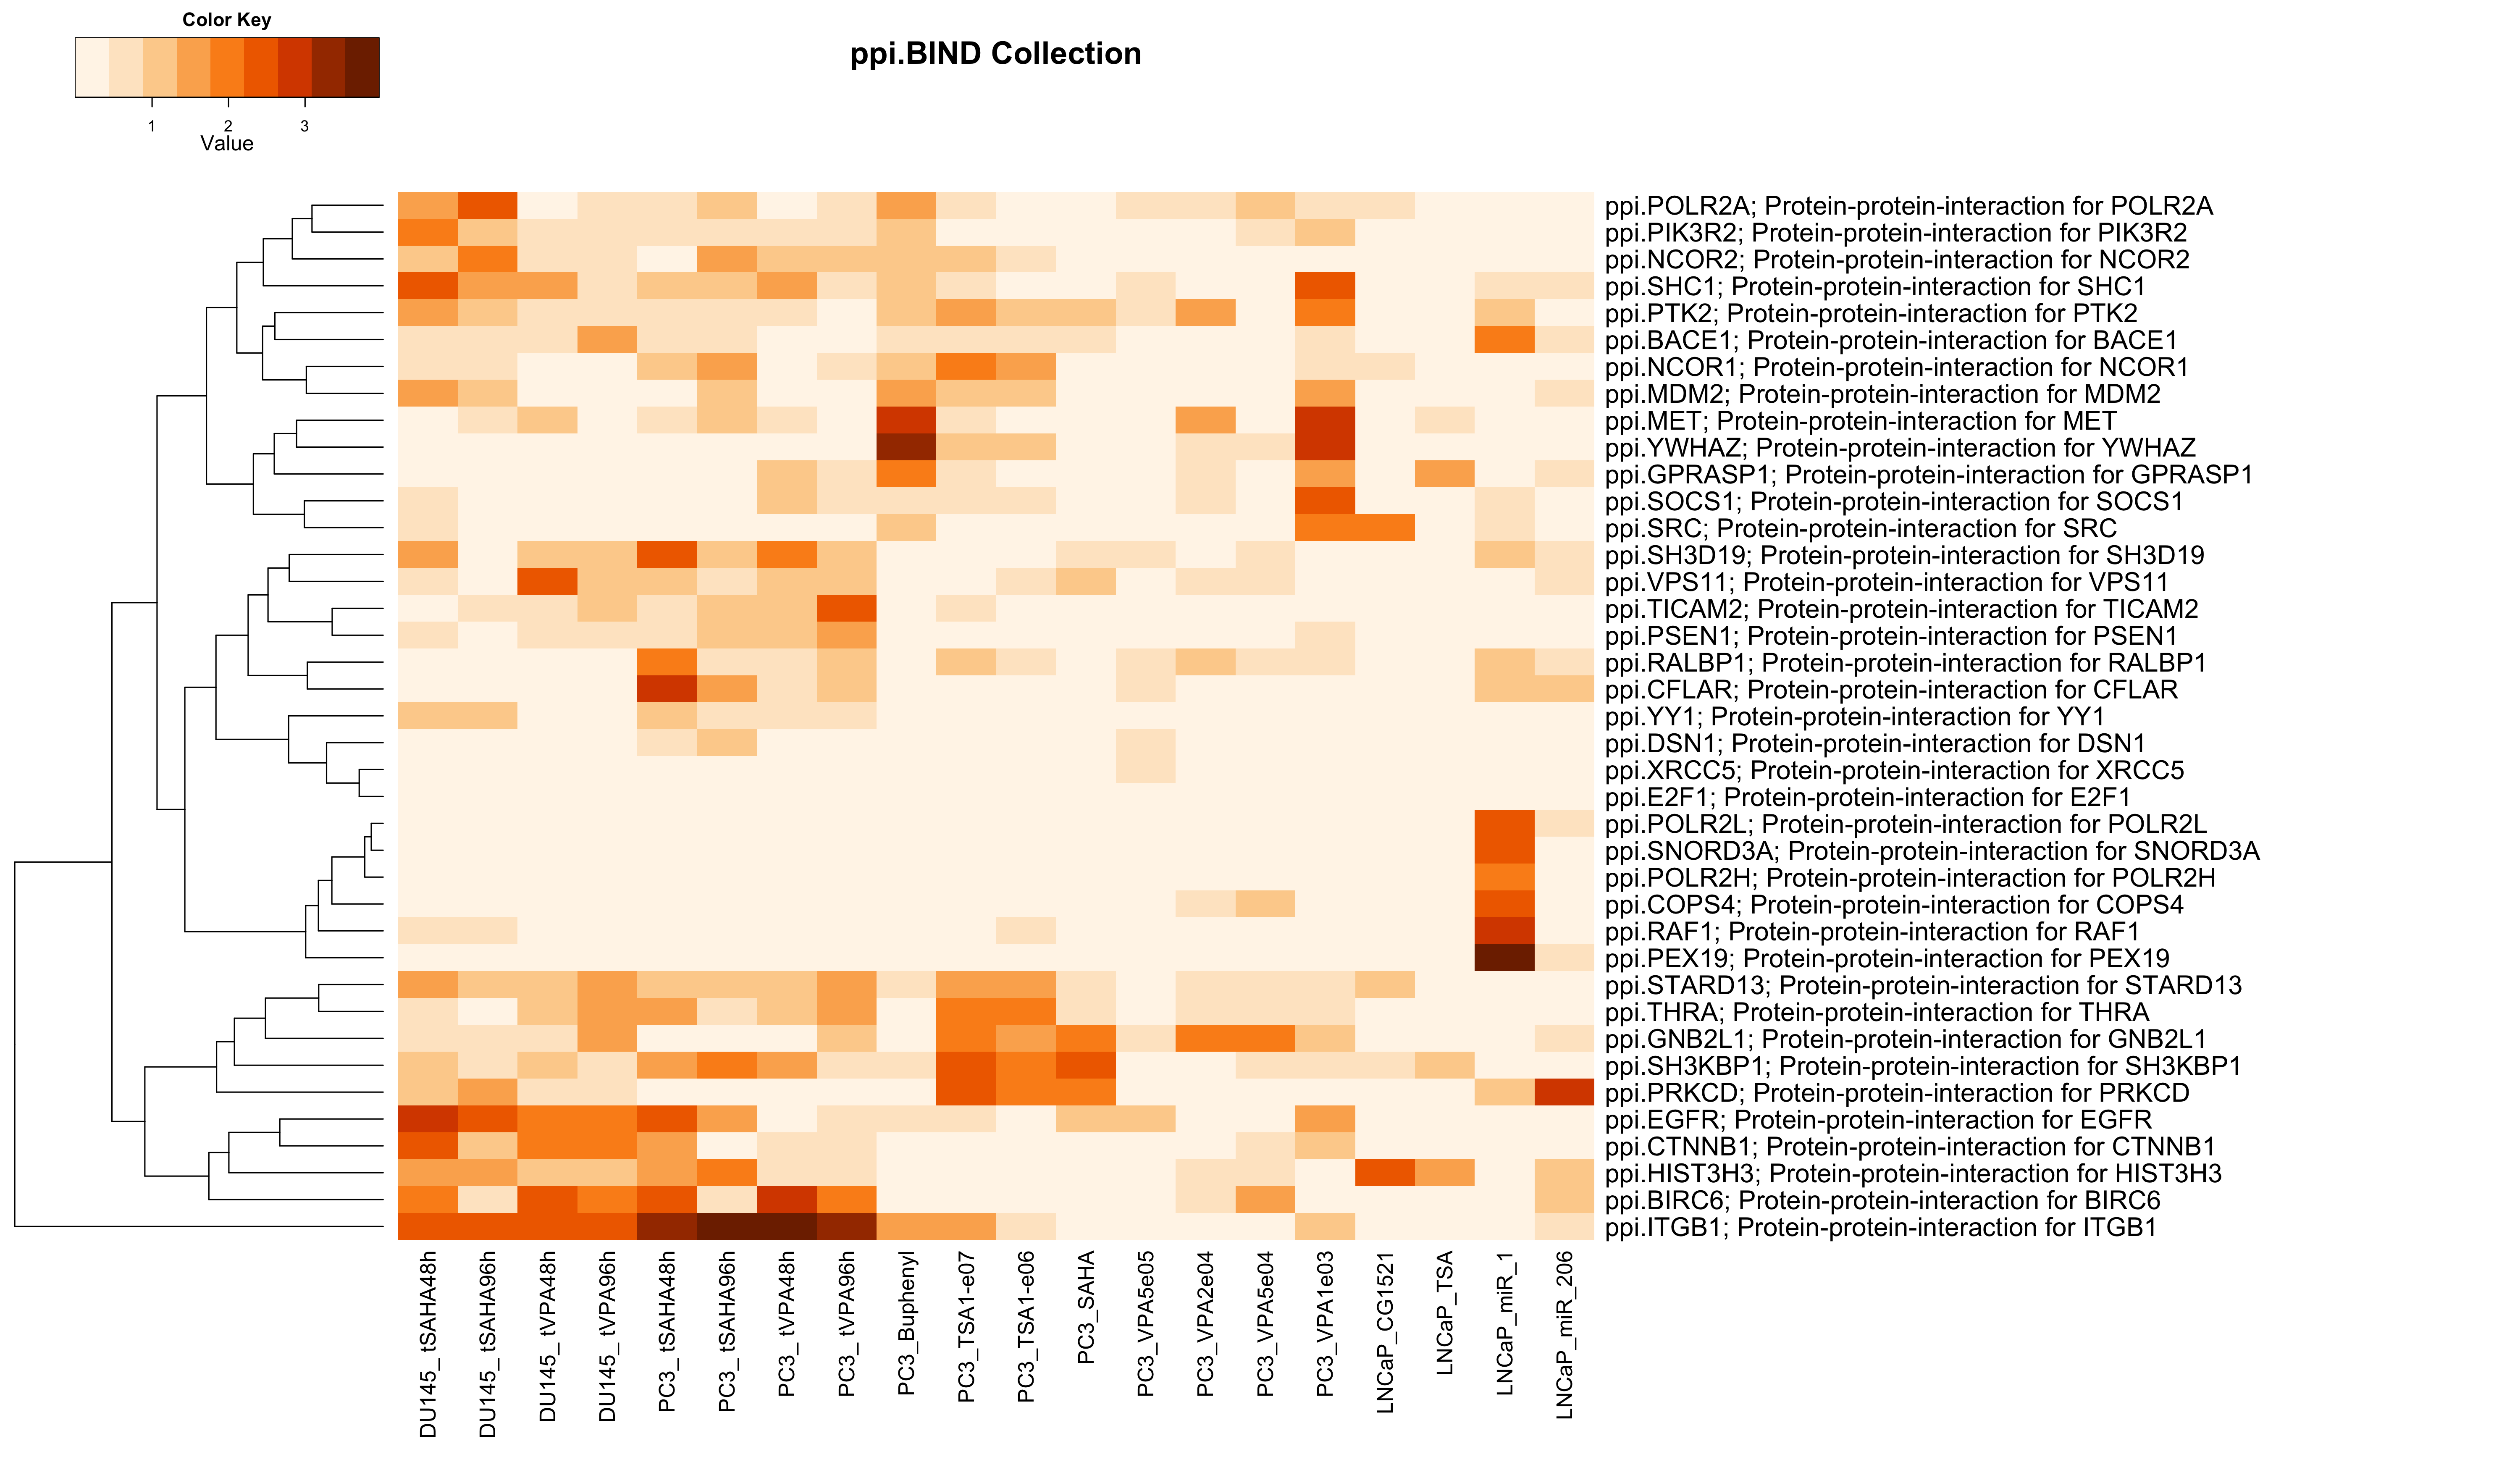
| upMax.ppi.BIND | Analysis of Functional Annotation for up-regulation; heatmap of the top 200 FGS enriched in at least one contrast (FDR < 0.01); the color scale represents the number of decimal digits of the unadjusted p-values from the Wlcoxon rank-sum test; results for upMax.ppi.BIND |
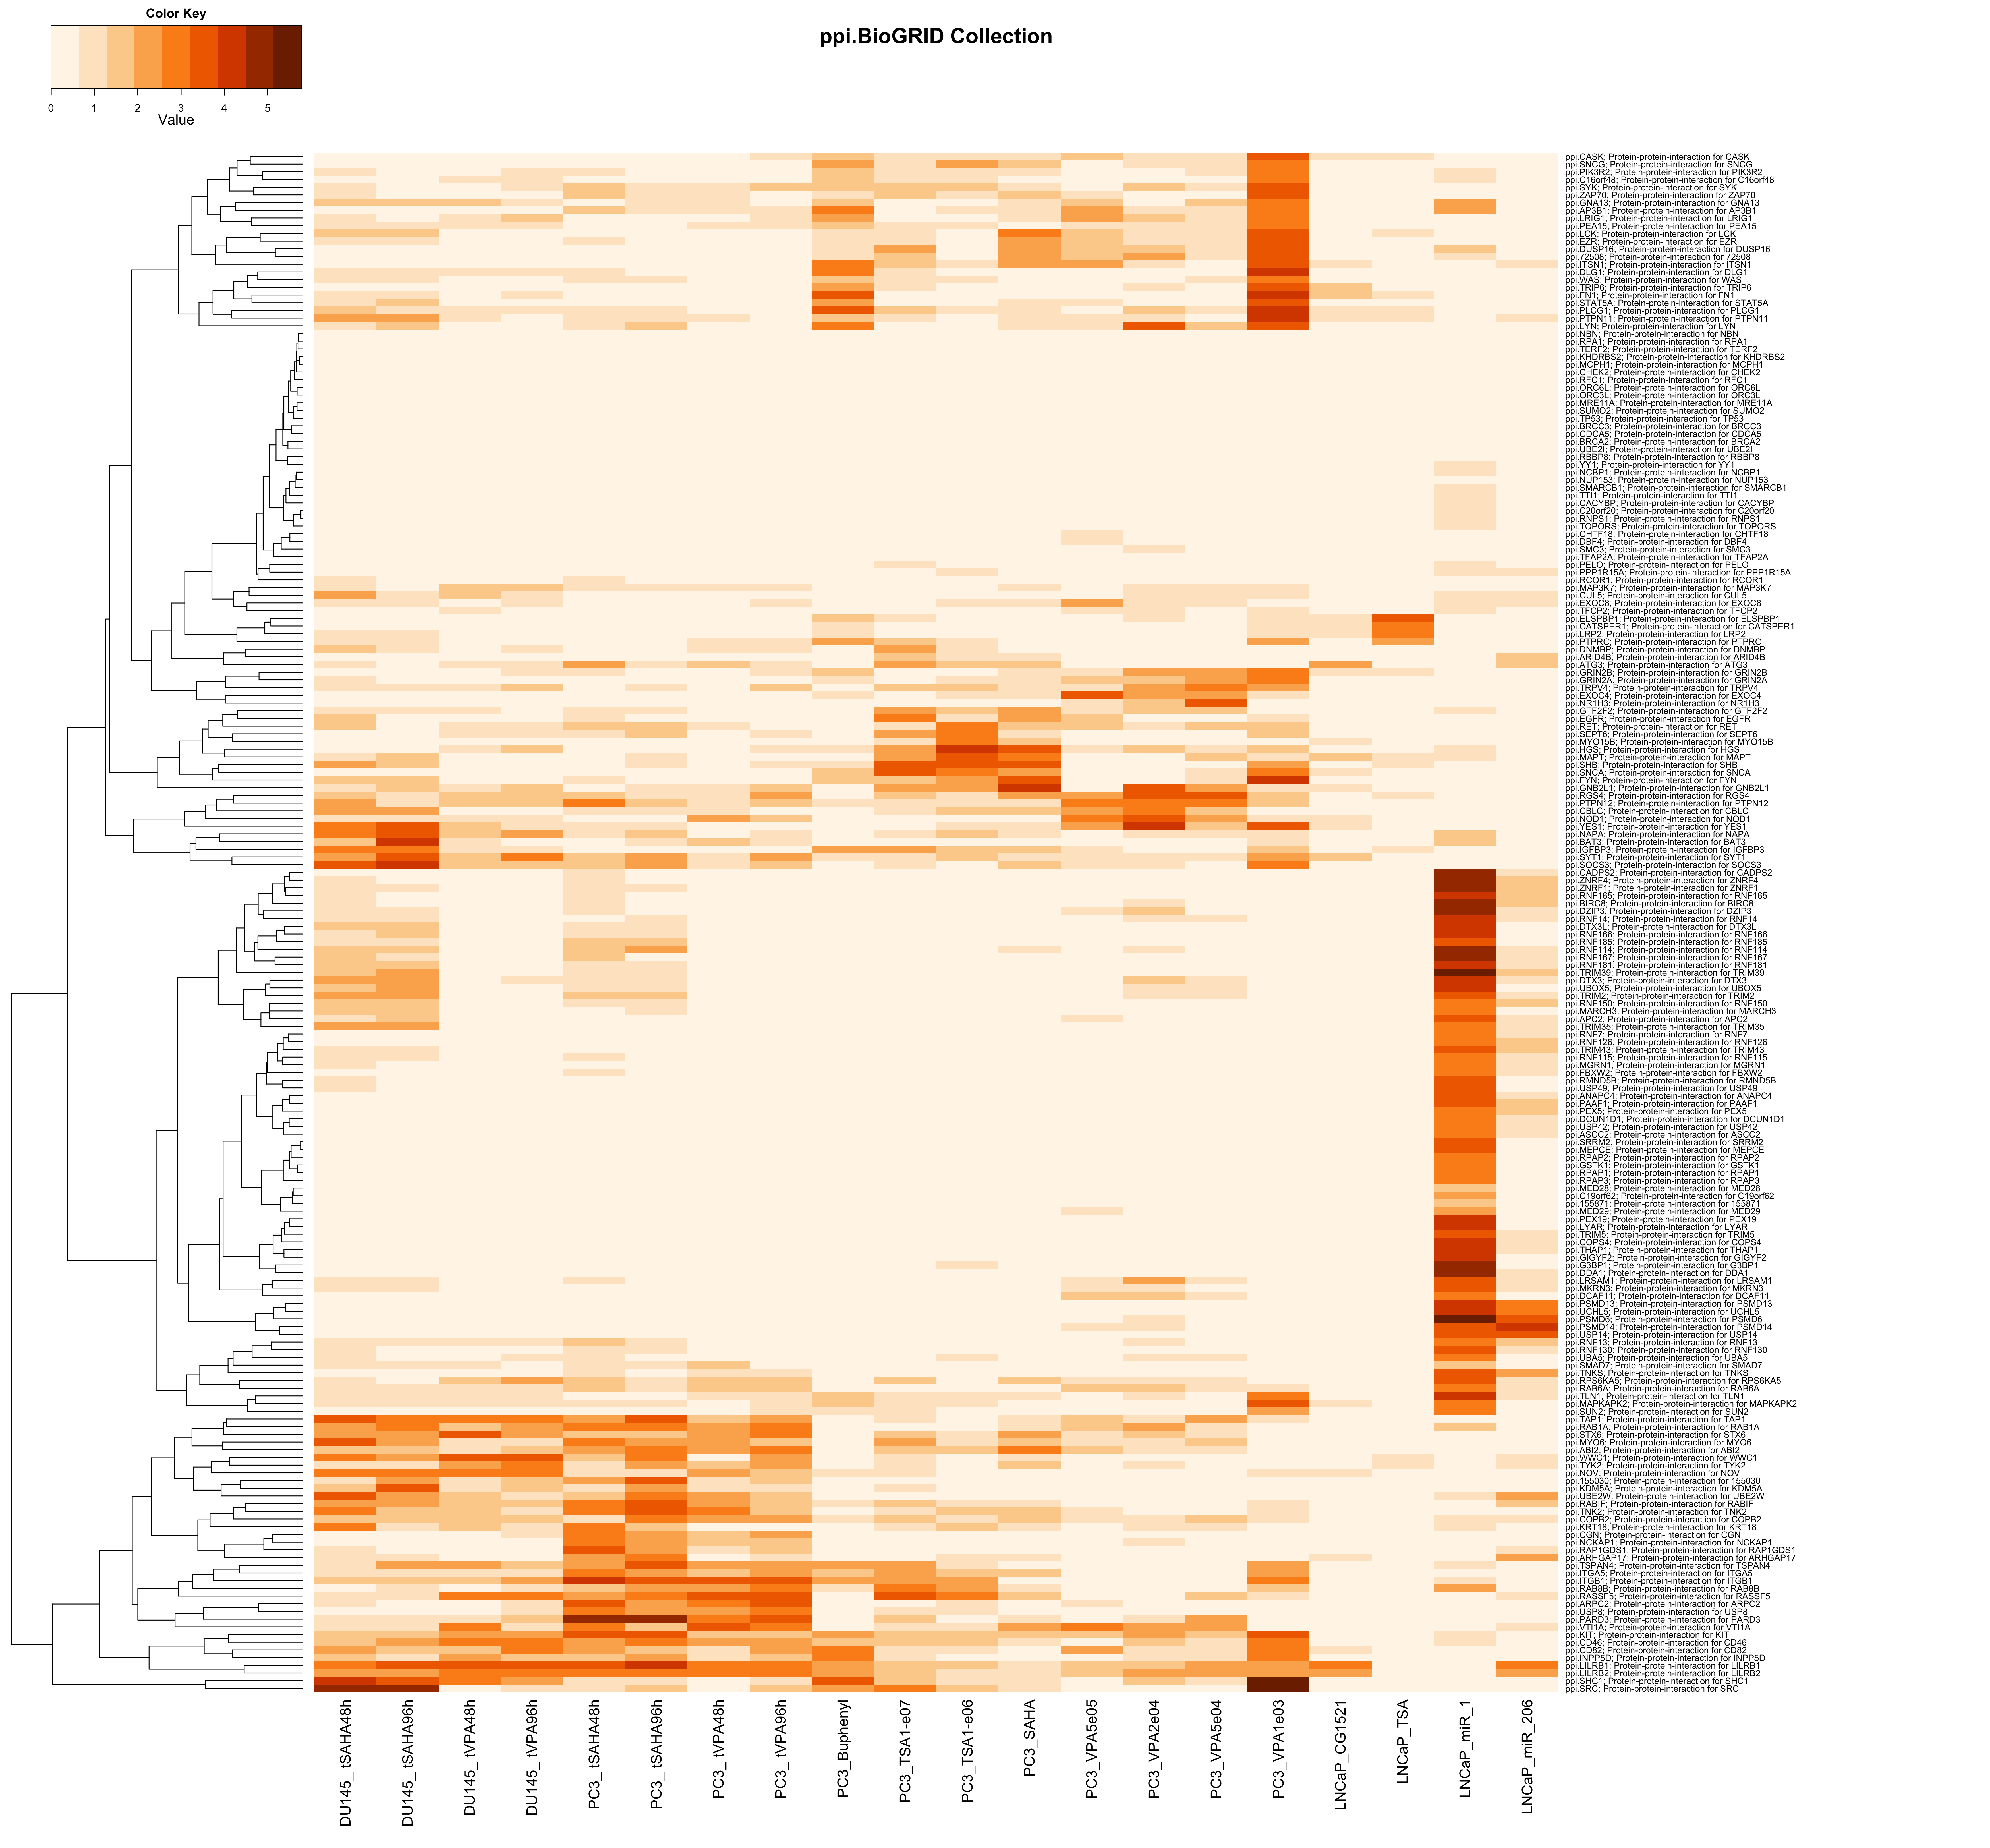
| upMax.ppi.BioGRID | Analysis of Functional Annotation for up-regulation; heatmap of the top 200 FGS enriched in at least one contrast (FDR < 0.01); the color scale represents the number of decimal digits of the unadjusted p-values from the Wlcoxon rank-sum test; results for upMax.ppi.BioGRID |
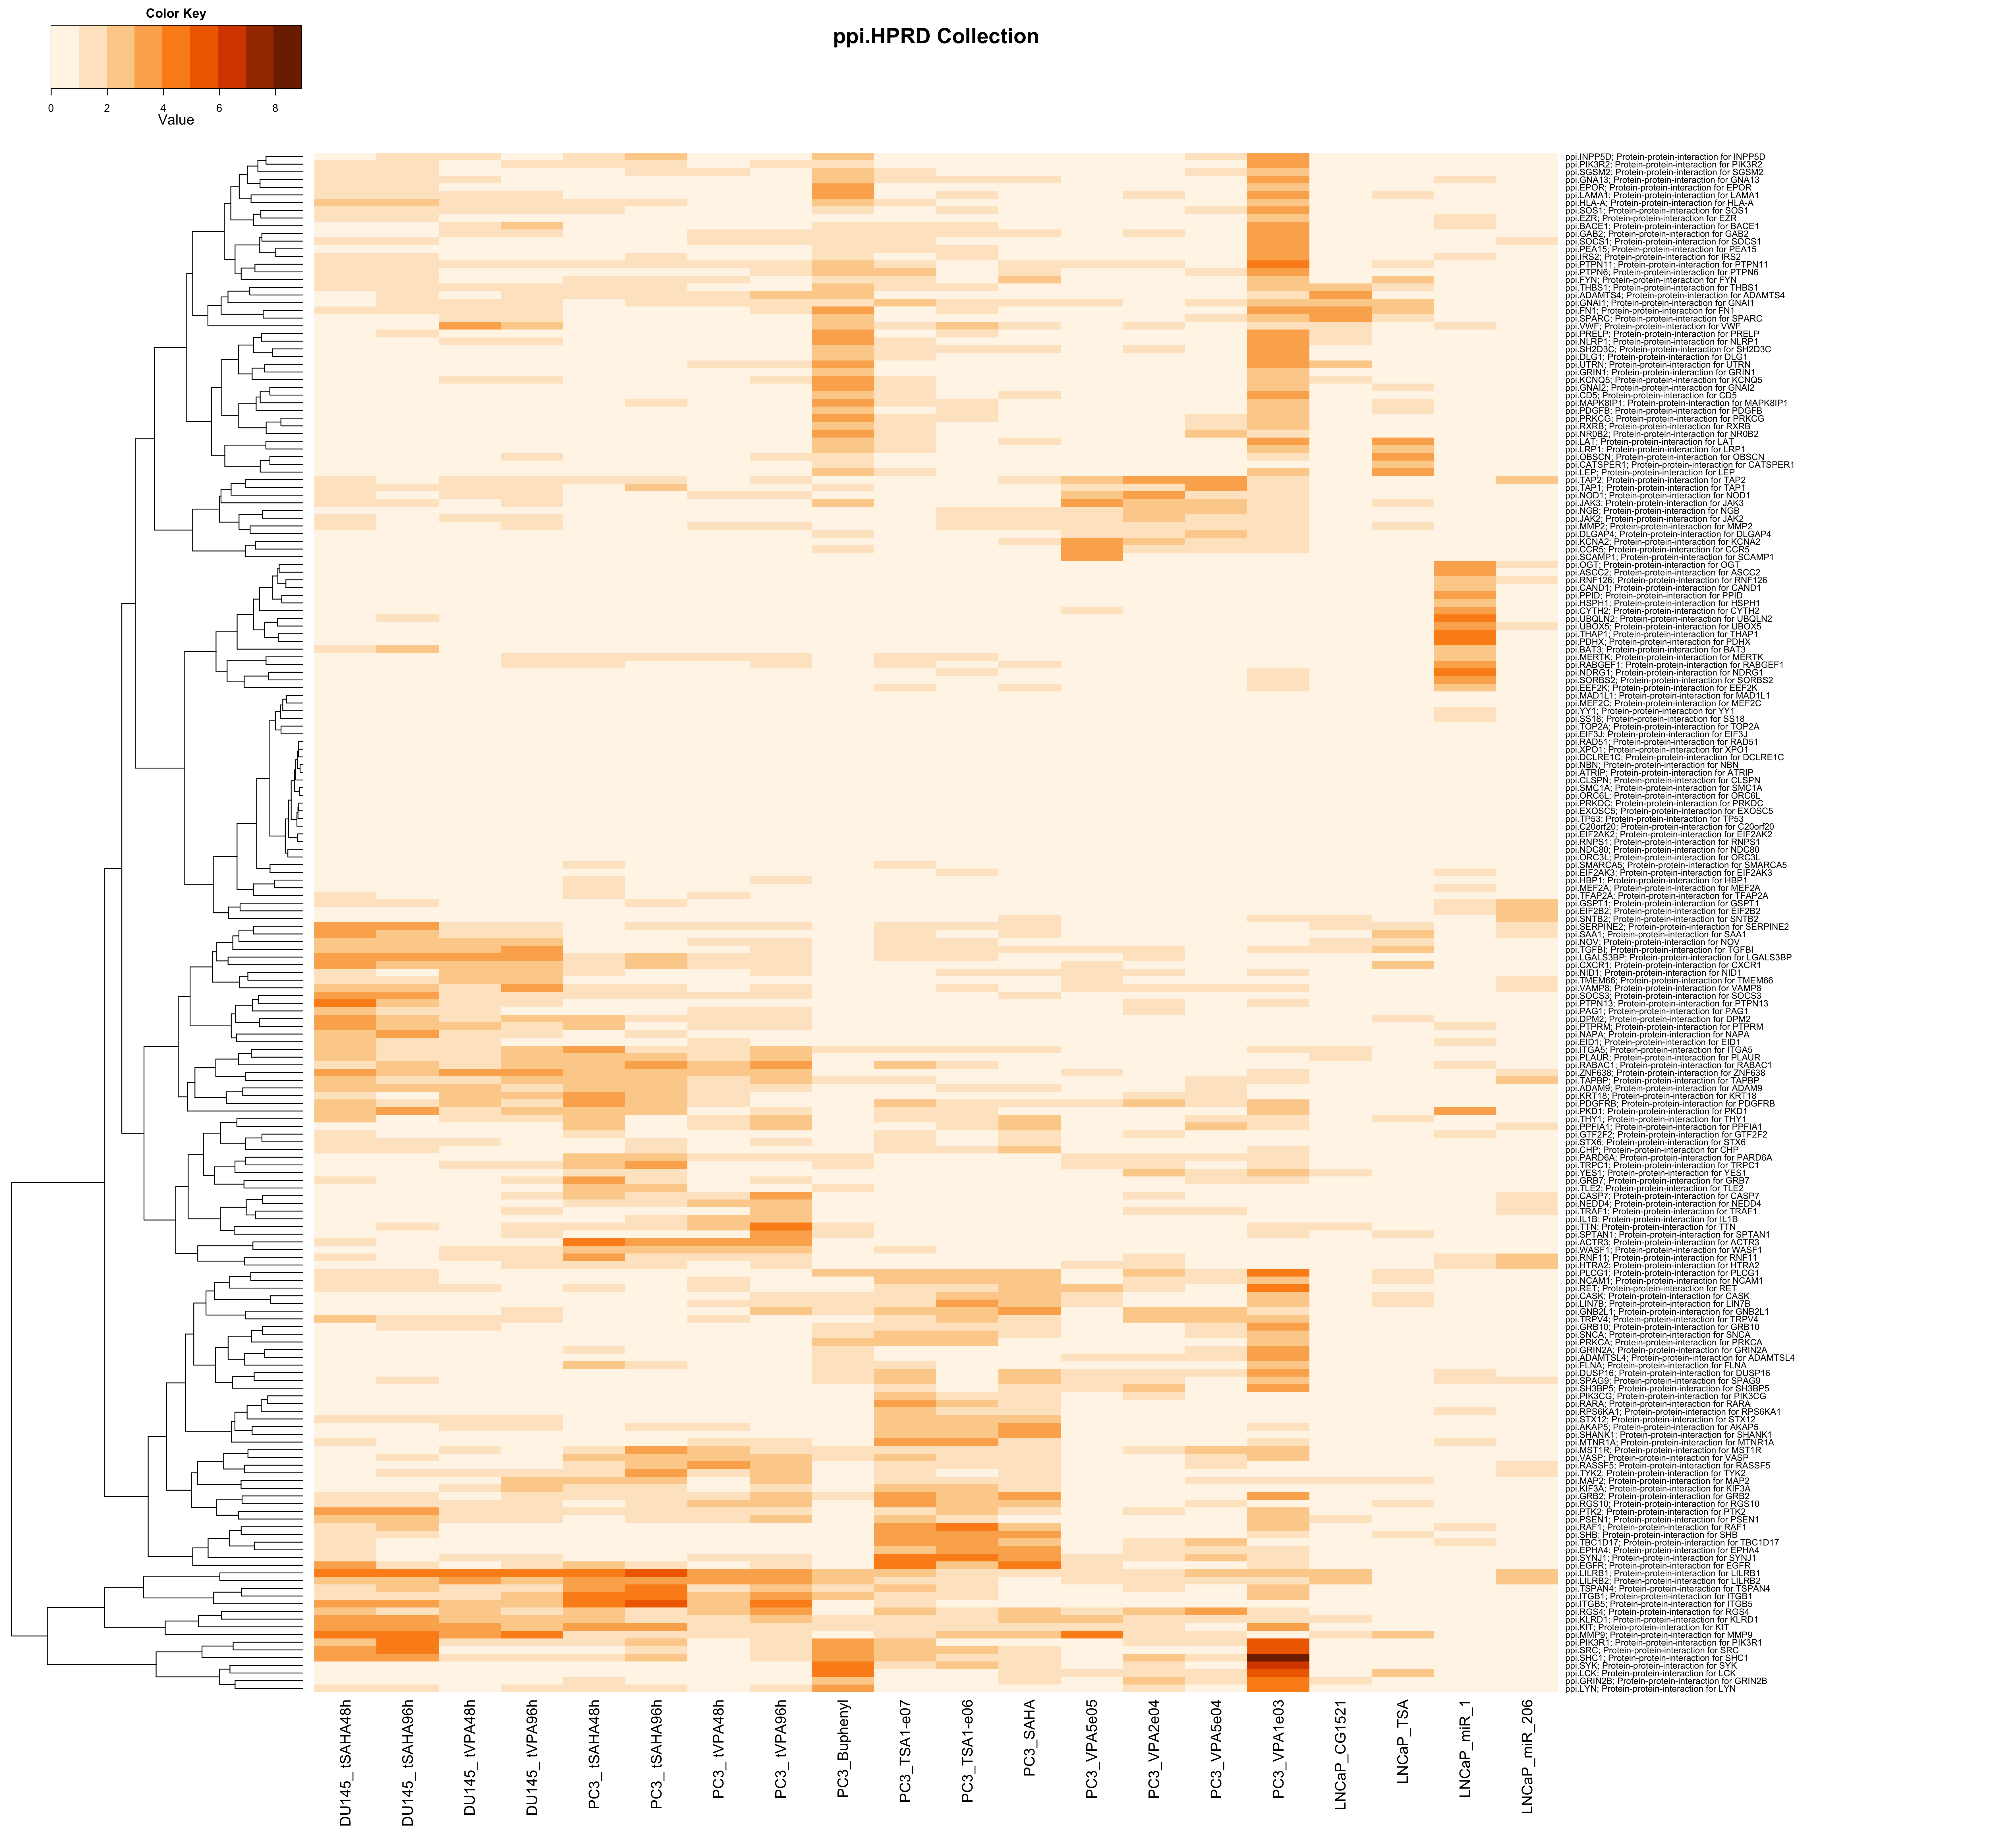
| upMax.ppi.HPRD | Analysis of Functional Annotation for up-regulation; heatmap of the top 200 FGS enriched in at least one contrast (FDR < 0.01); the color scale represents the number of decimal digits of the unadjusted p-values from the Wlcoxon rank-sum test; results for upMax.ppi.HPRD |
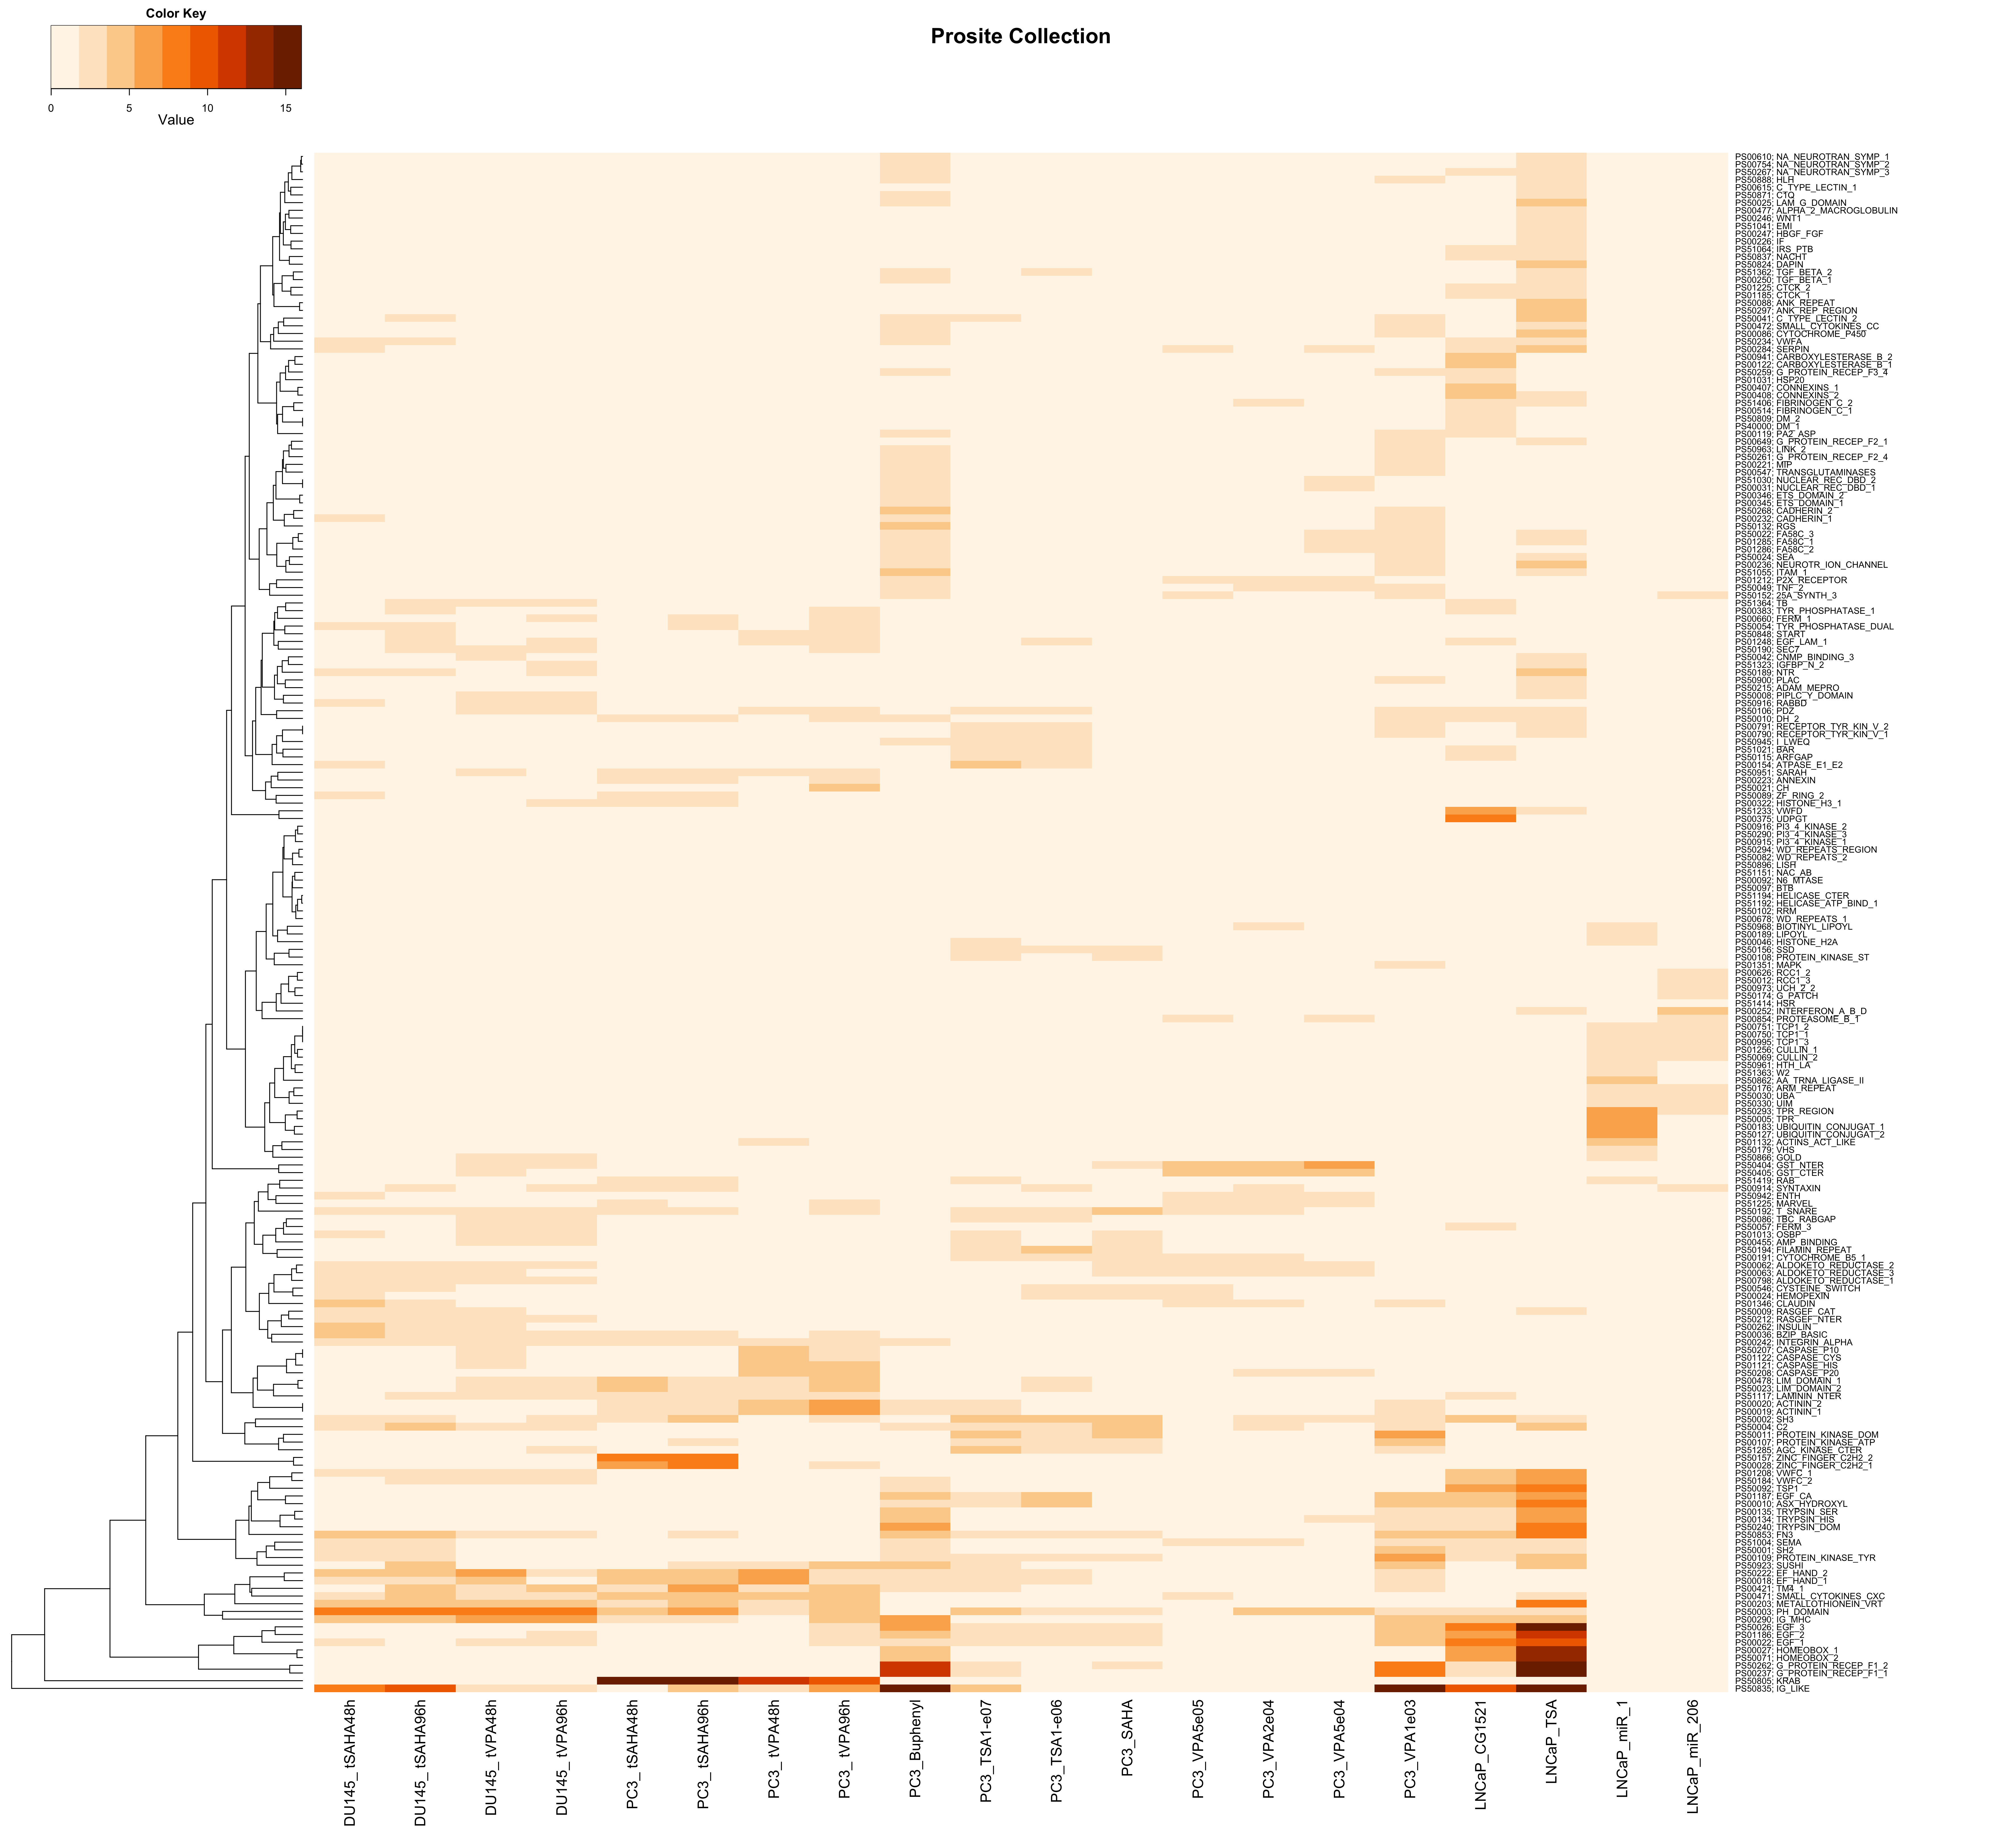
| upMax.Prosite | Analysis of Functional Annotation for up-regulation; heatmap of the top 200 FGS enriched in at least one contrast (FDR < 0.01); the color scale represents the number of decimal digits of the unadjusted p-values from the Wlcoxon rank-sum test; results for upMax.Prosite |
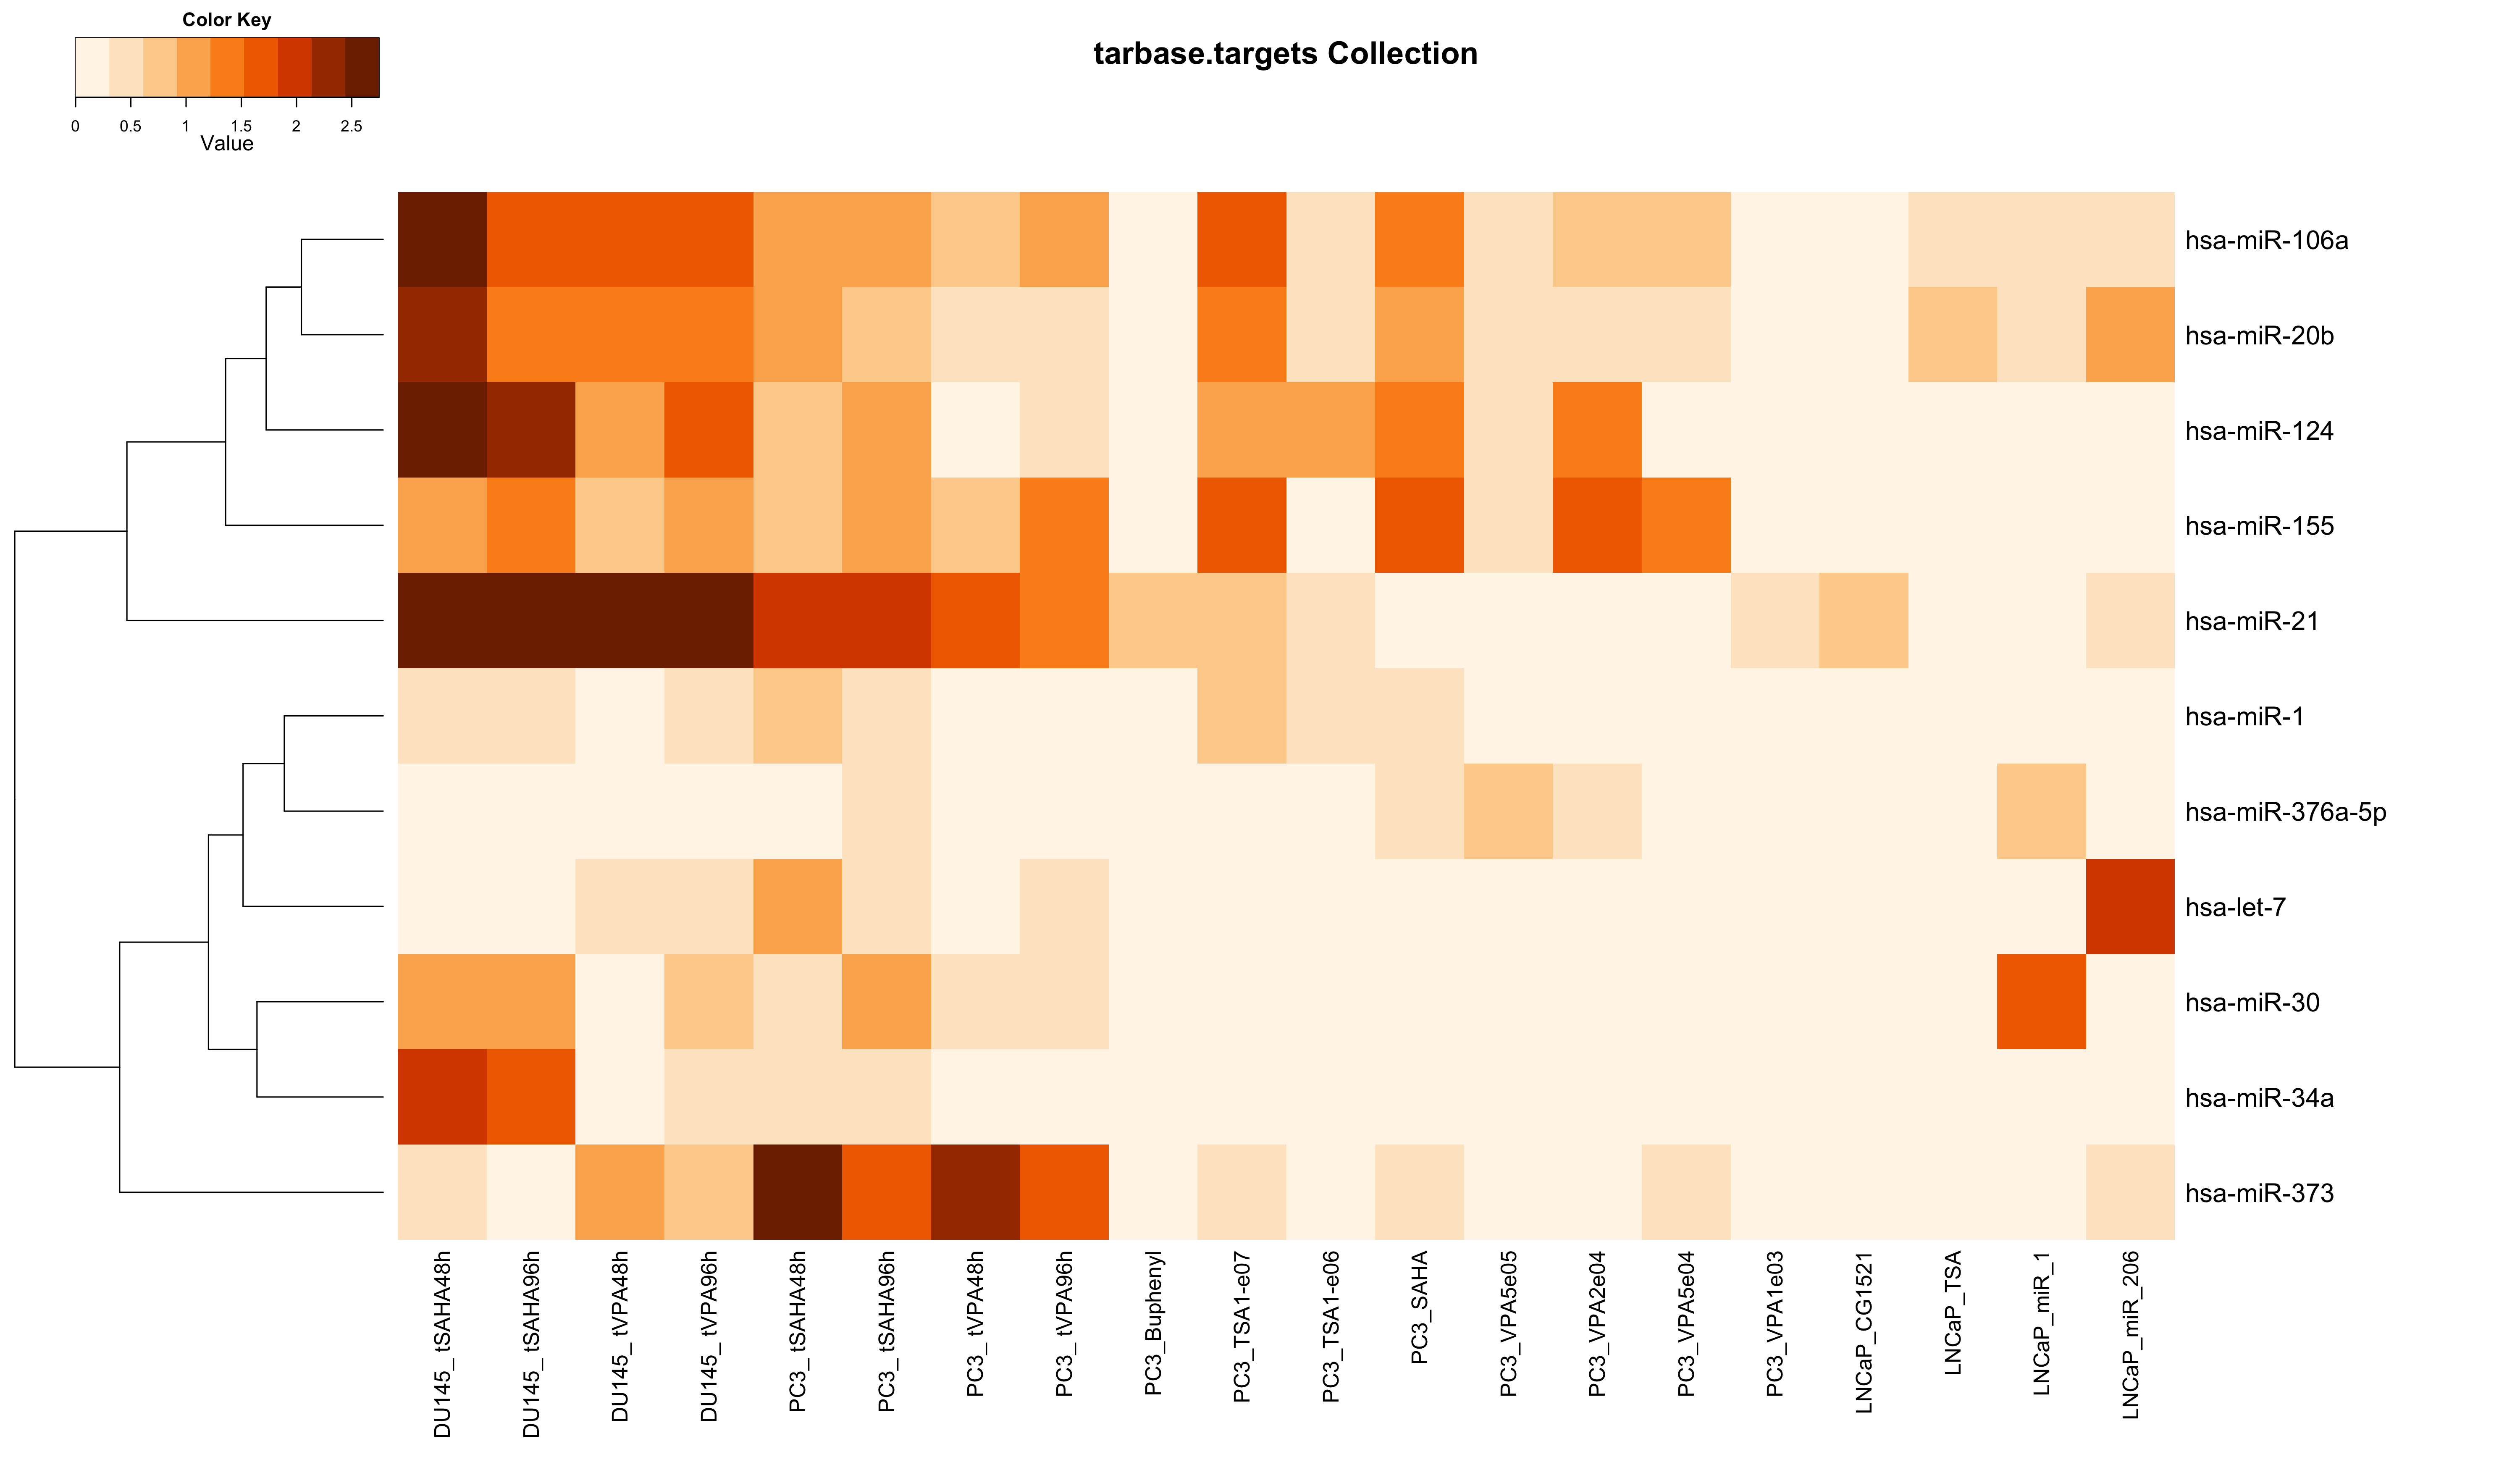
| upMax.tarbase.targets | Analysis of Functional Annotation for up-regulation; heatmap of the top 200 FGS enriched in at least one contrast (FDR < 0.01); the color scale represents the number of decimal digits of the unadjusted p-values from the Wlcoxon rank-sum test; results for upMax.tarbase.targets |
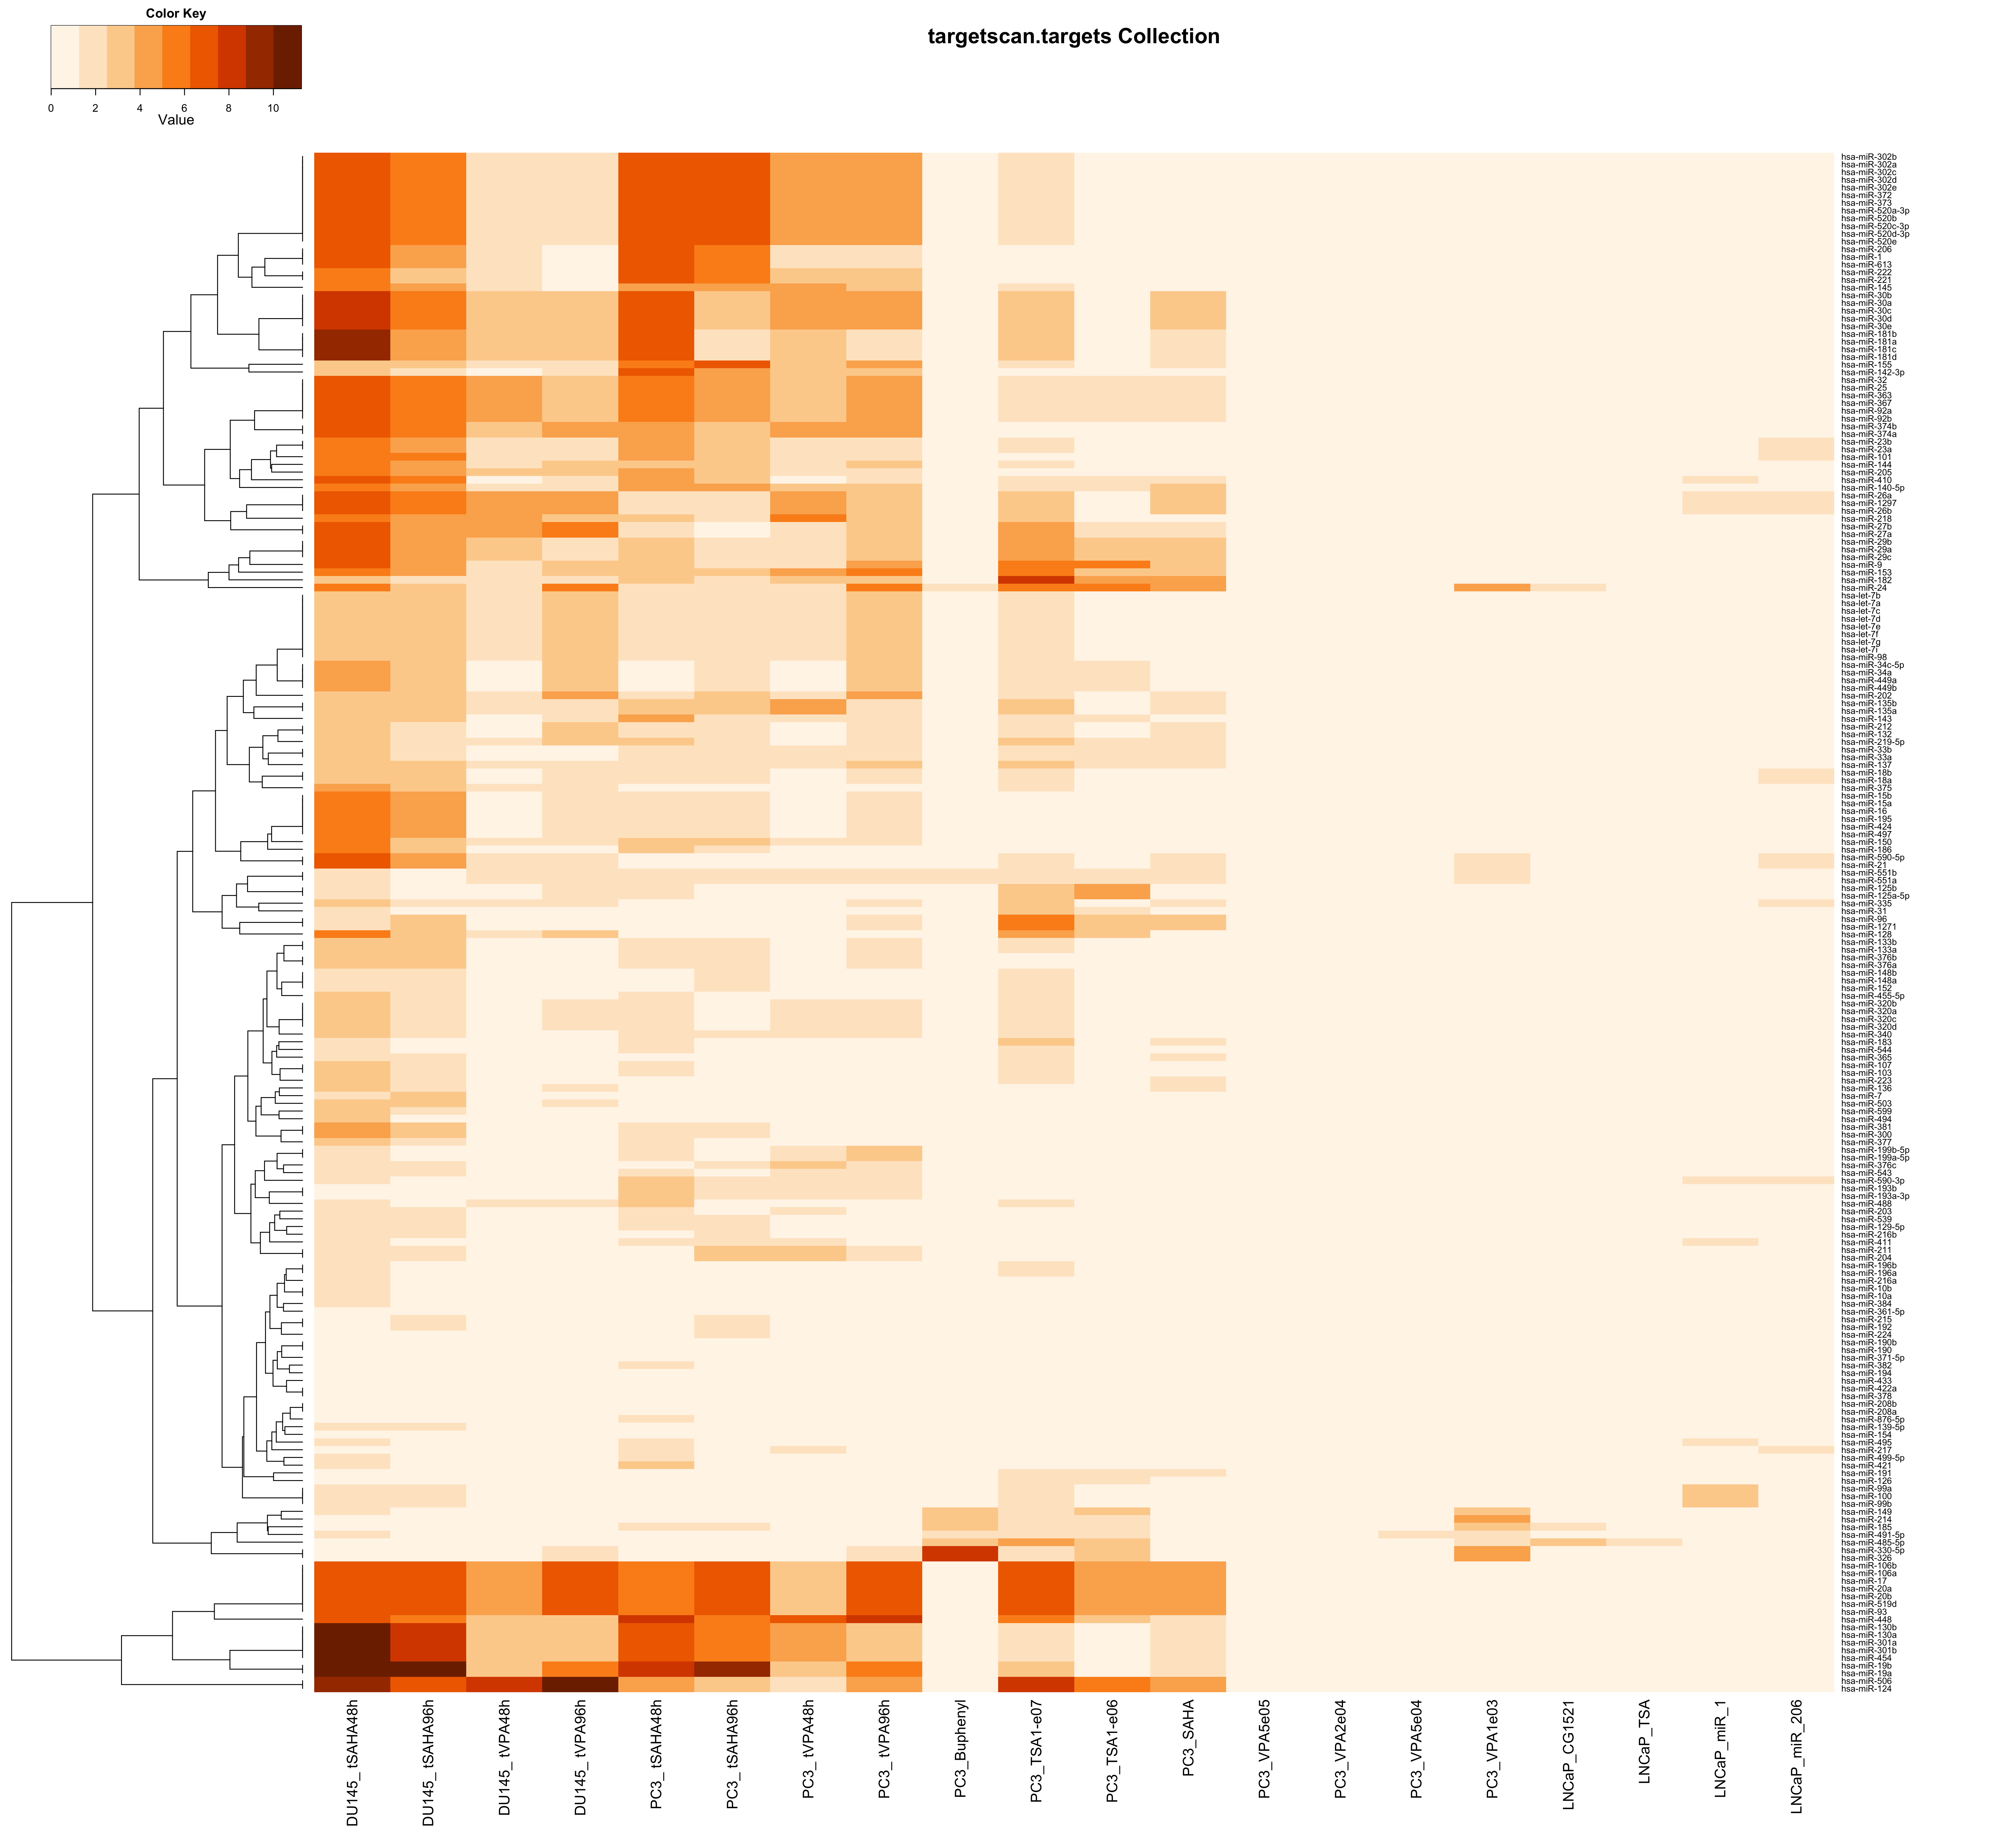
| upMax.targetscan.targets | Analysis of Functional Annotation for up-regulation; heatmap of the top 200 FGS enriched in at least one contrast (FDR < 0.01); the color scale represents the number of decimal digits of the unadjusted p-values from the Wlcoxon rank-sum test; results for upMax.targetscan.targets |
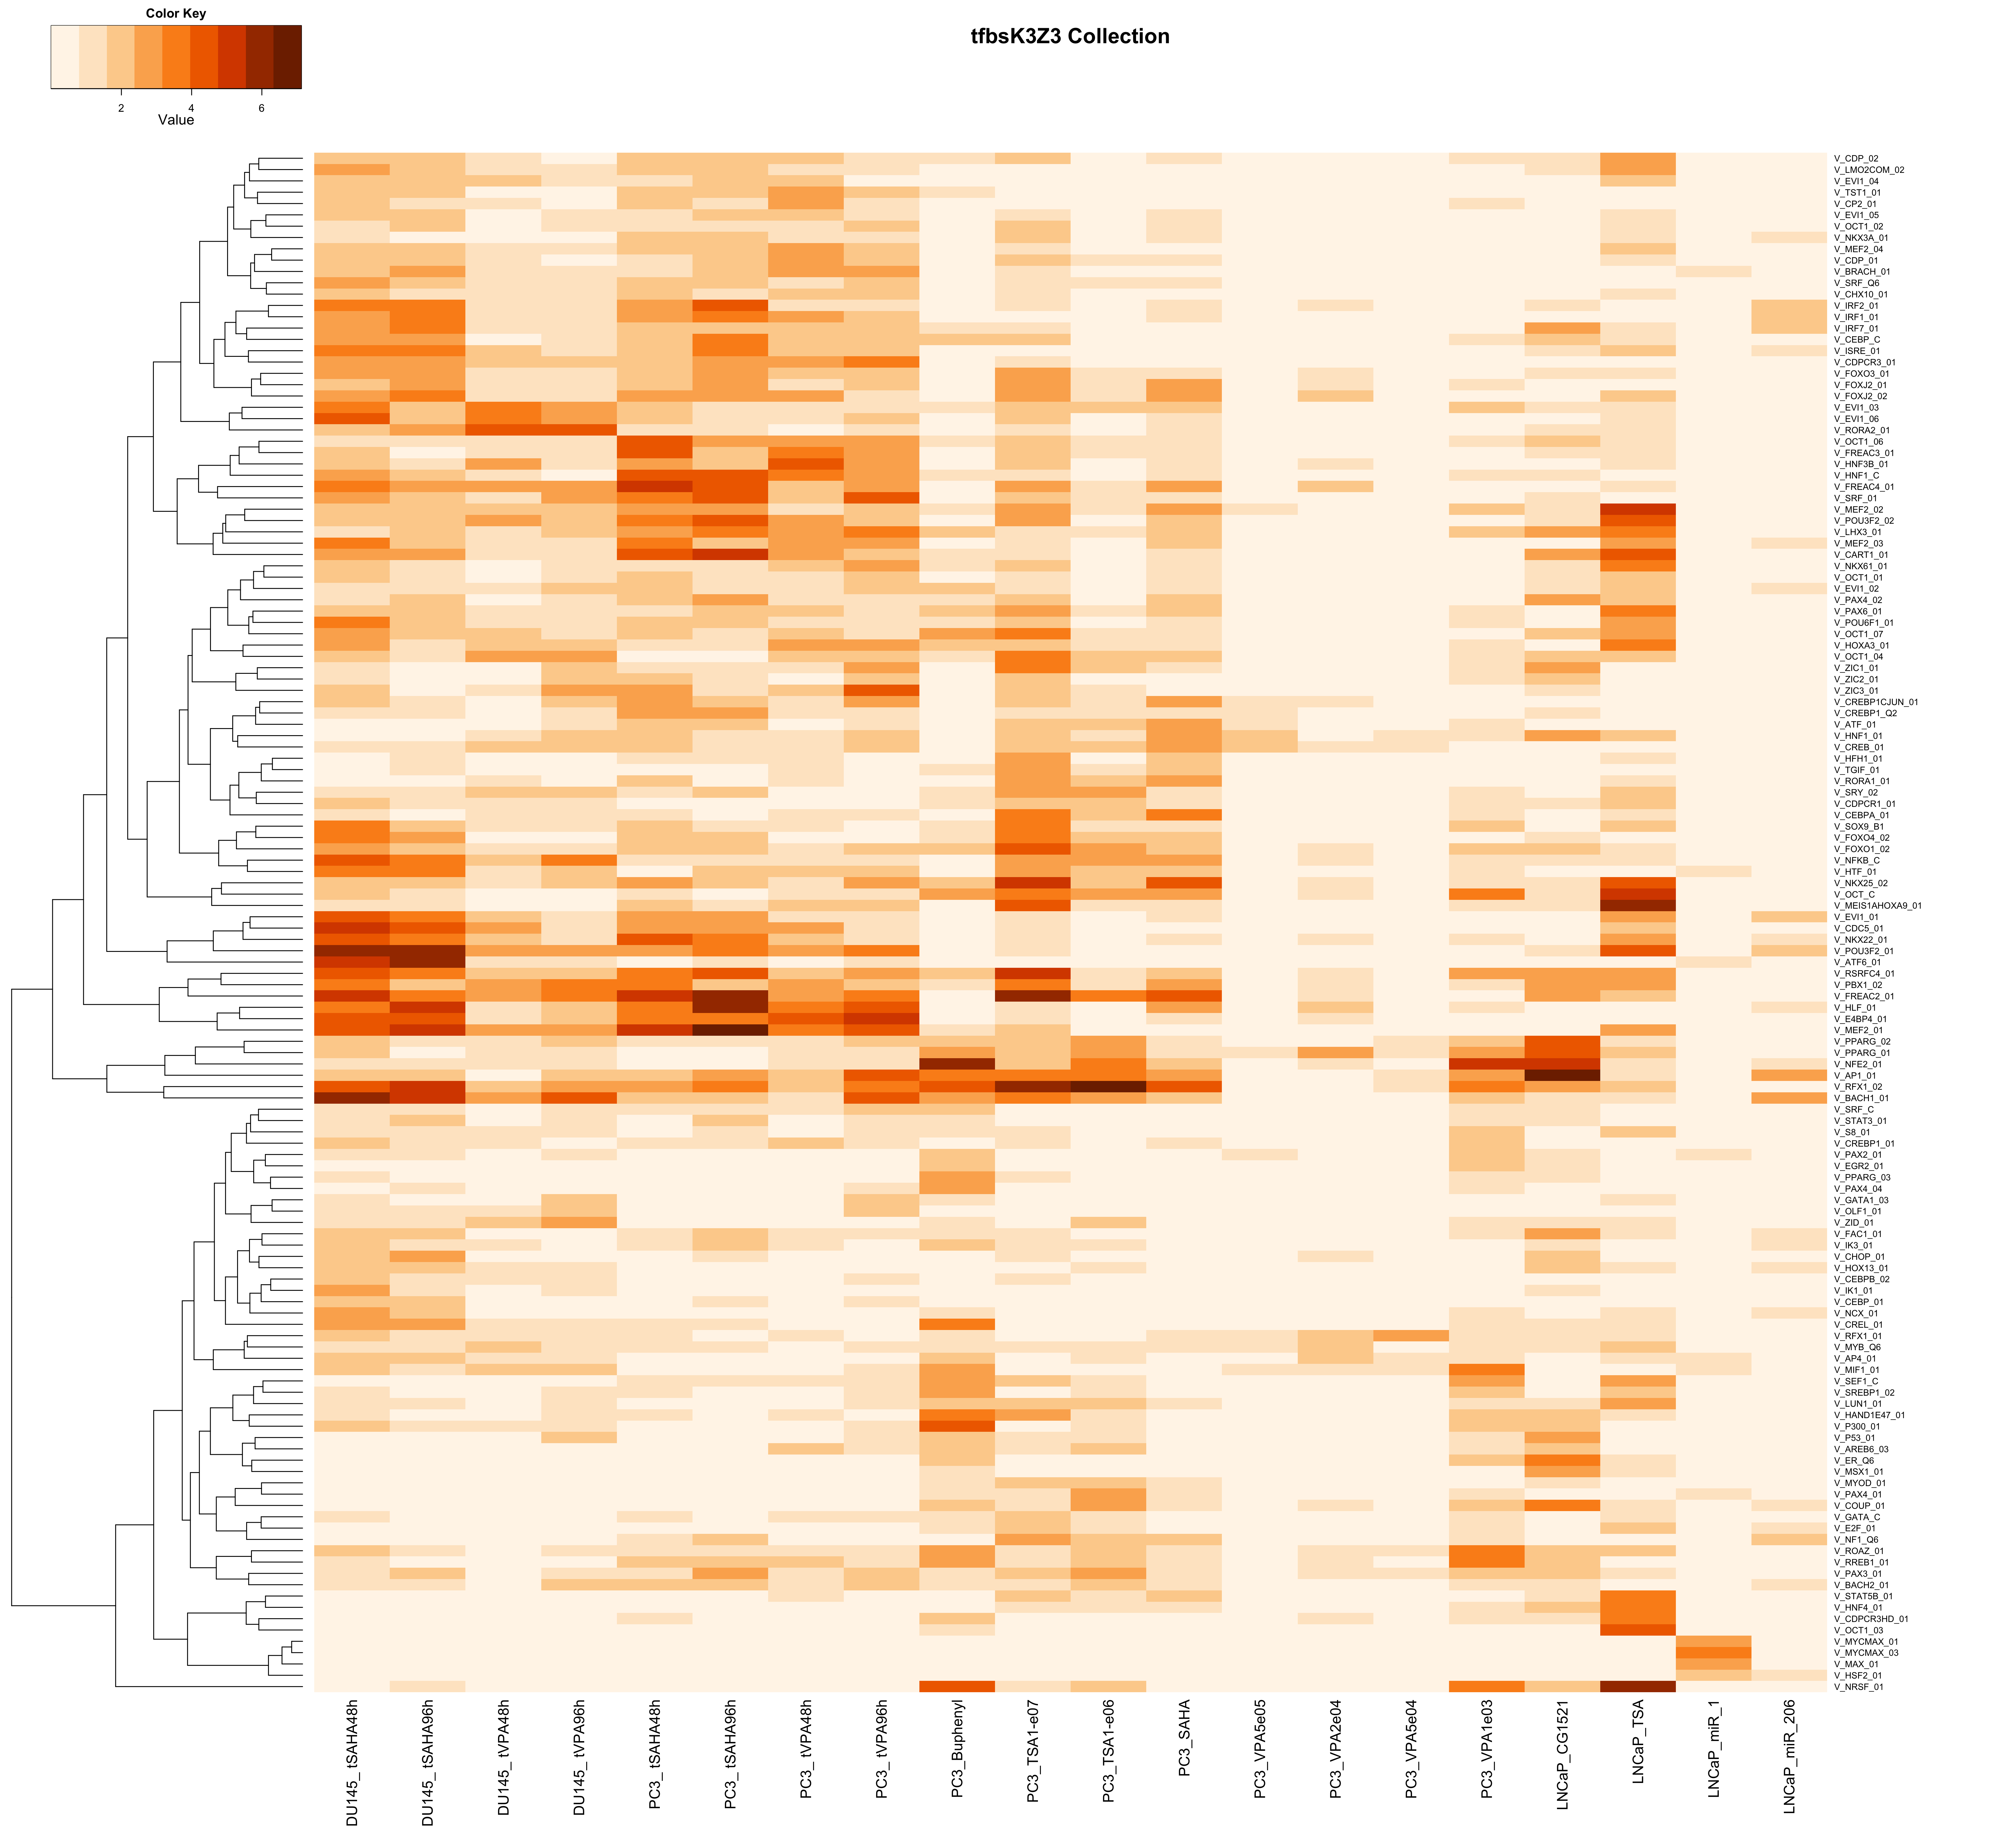
| upMax.tfbsK3Z3 | Analysis of Functional Annotation for up-regulation; heatmap of the top 200 FGS enriched in at least one contrast (FDR < 0.01); the color scale represents the number of decimal digits of the unadjusted p-values from the Wlcoxon rank-sum test; results for upMax.tfbsK3Z3 |