| FileName | Description |
| ANOVA.ls | ANOVA MODEL (all genes and samples, least squares), log2 fold change for all groups, genes with F-statistics > 90th percentile |
| ANOVA.rb | ANOVA MODEL (all genes and samples, robust), log2 fold change for all groups, genes with F-statistics > 90th percentile |
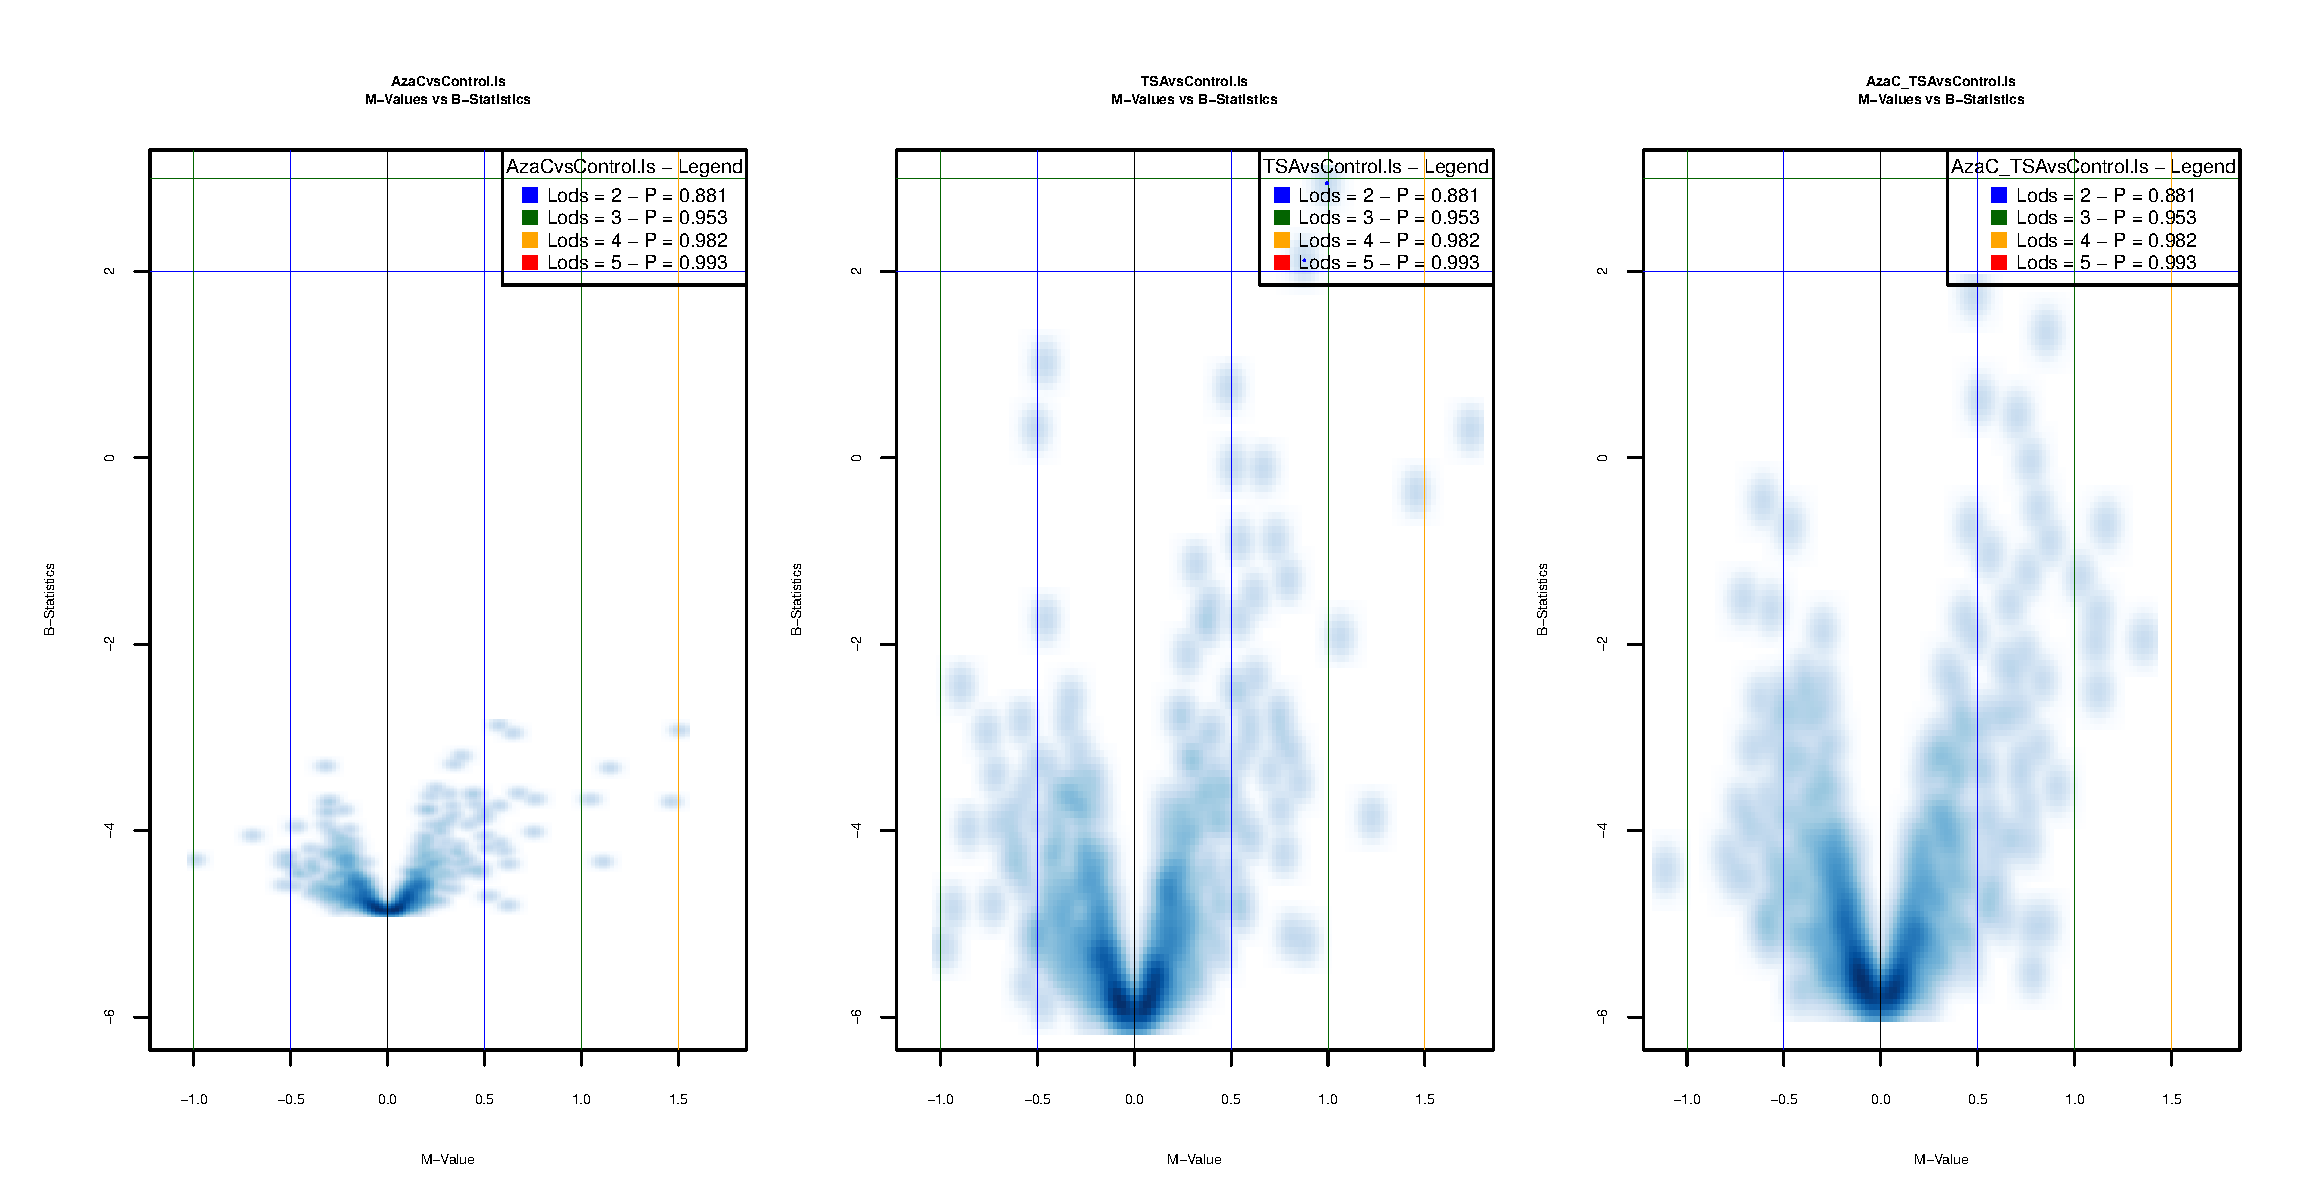
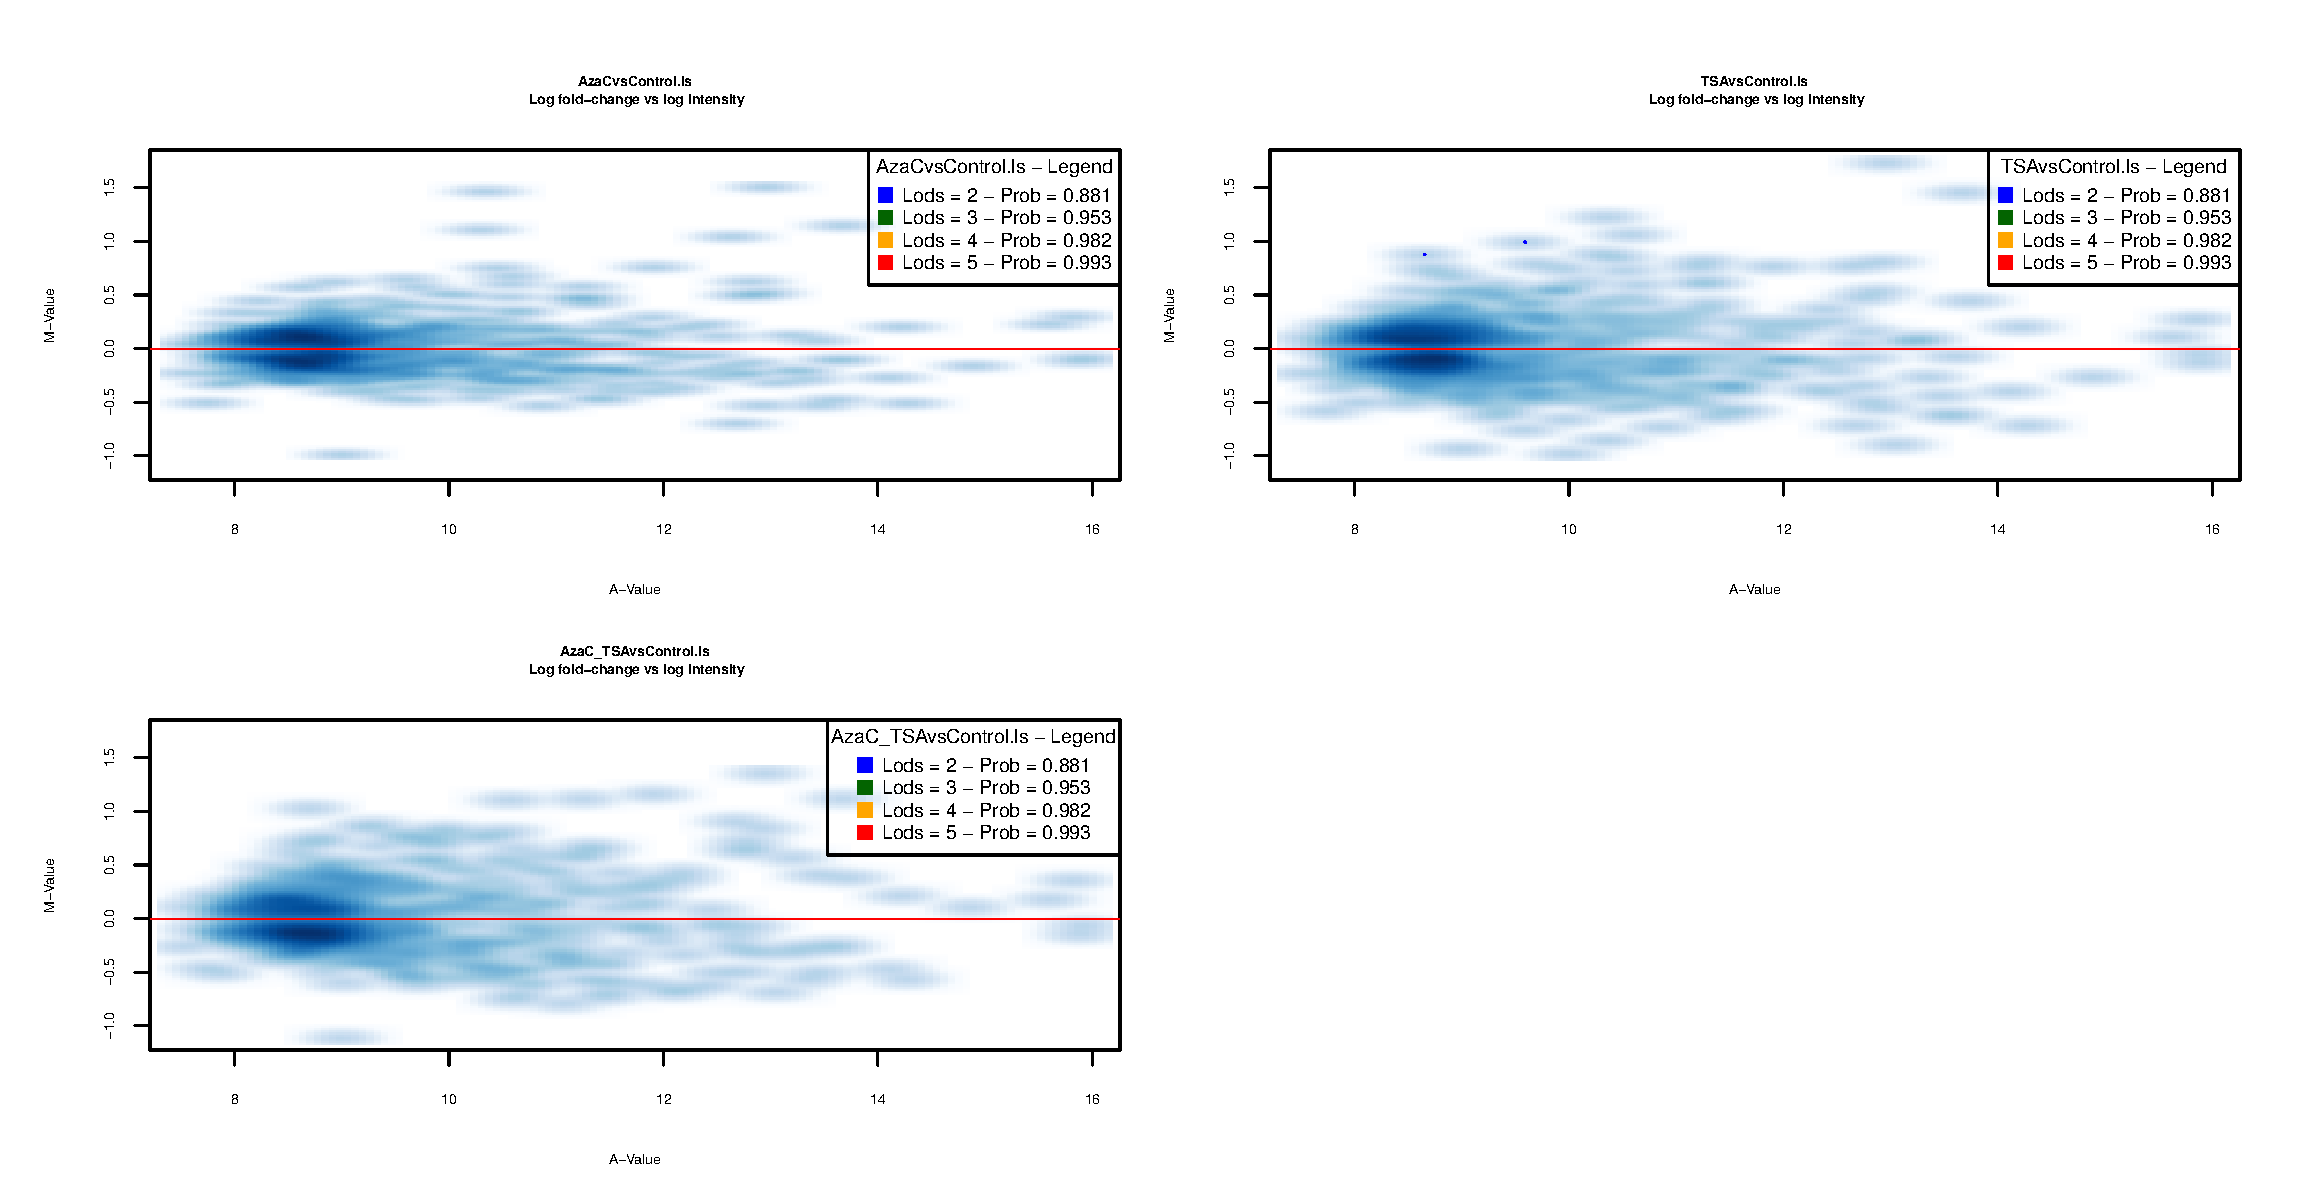
| AzaC_TSAvsControl.ls | ANOVA MODEL (all genes and samples, least squares), AzaC_TSAvsControl contrast: AzaC + TSA vs. Control cell lines, genes with B-statistics > 90th percentile |
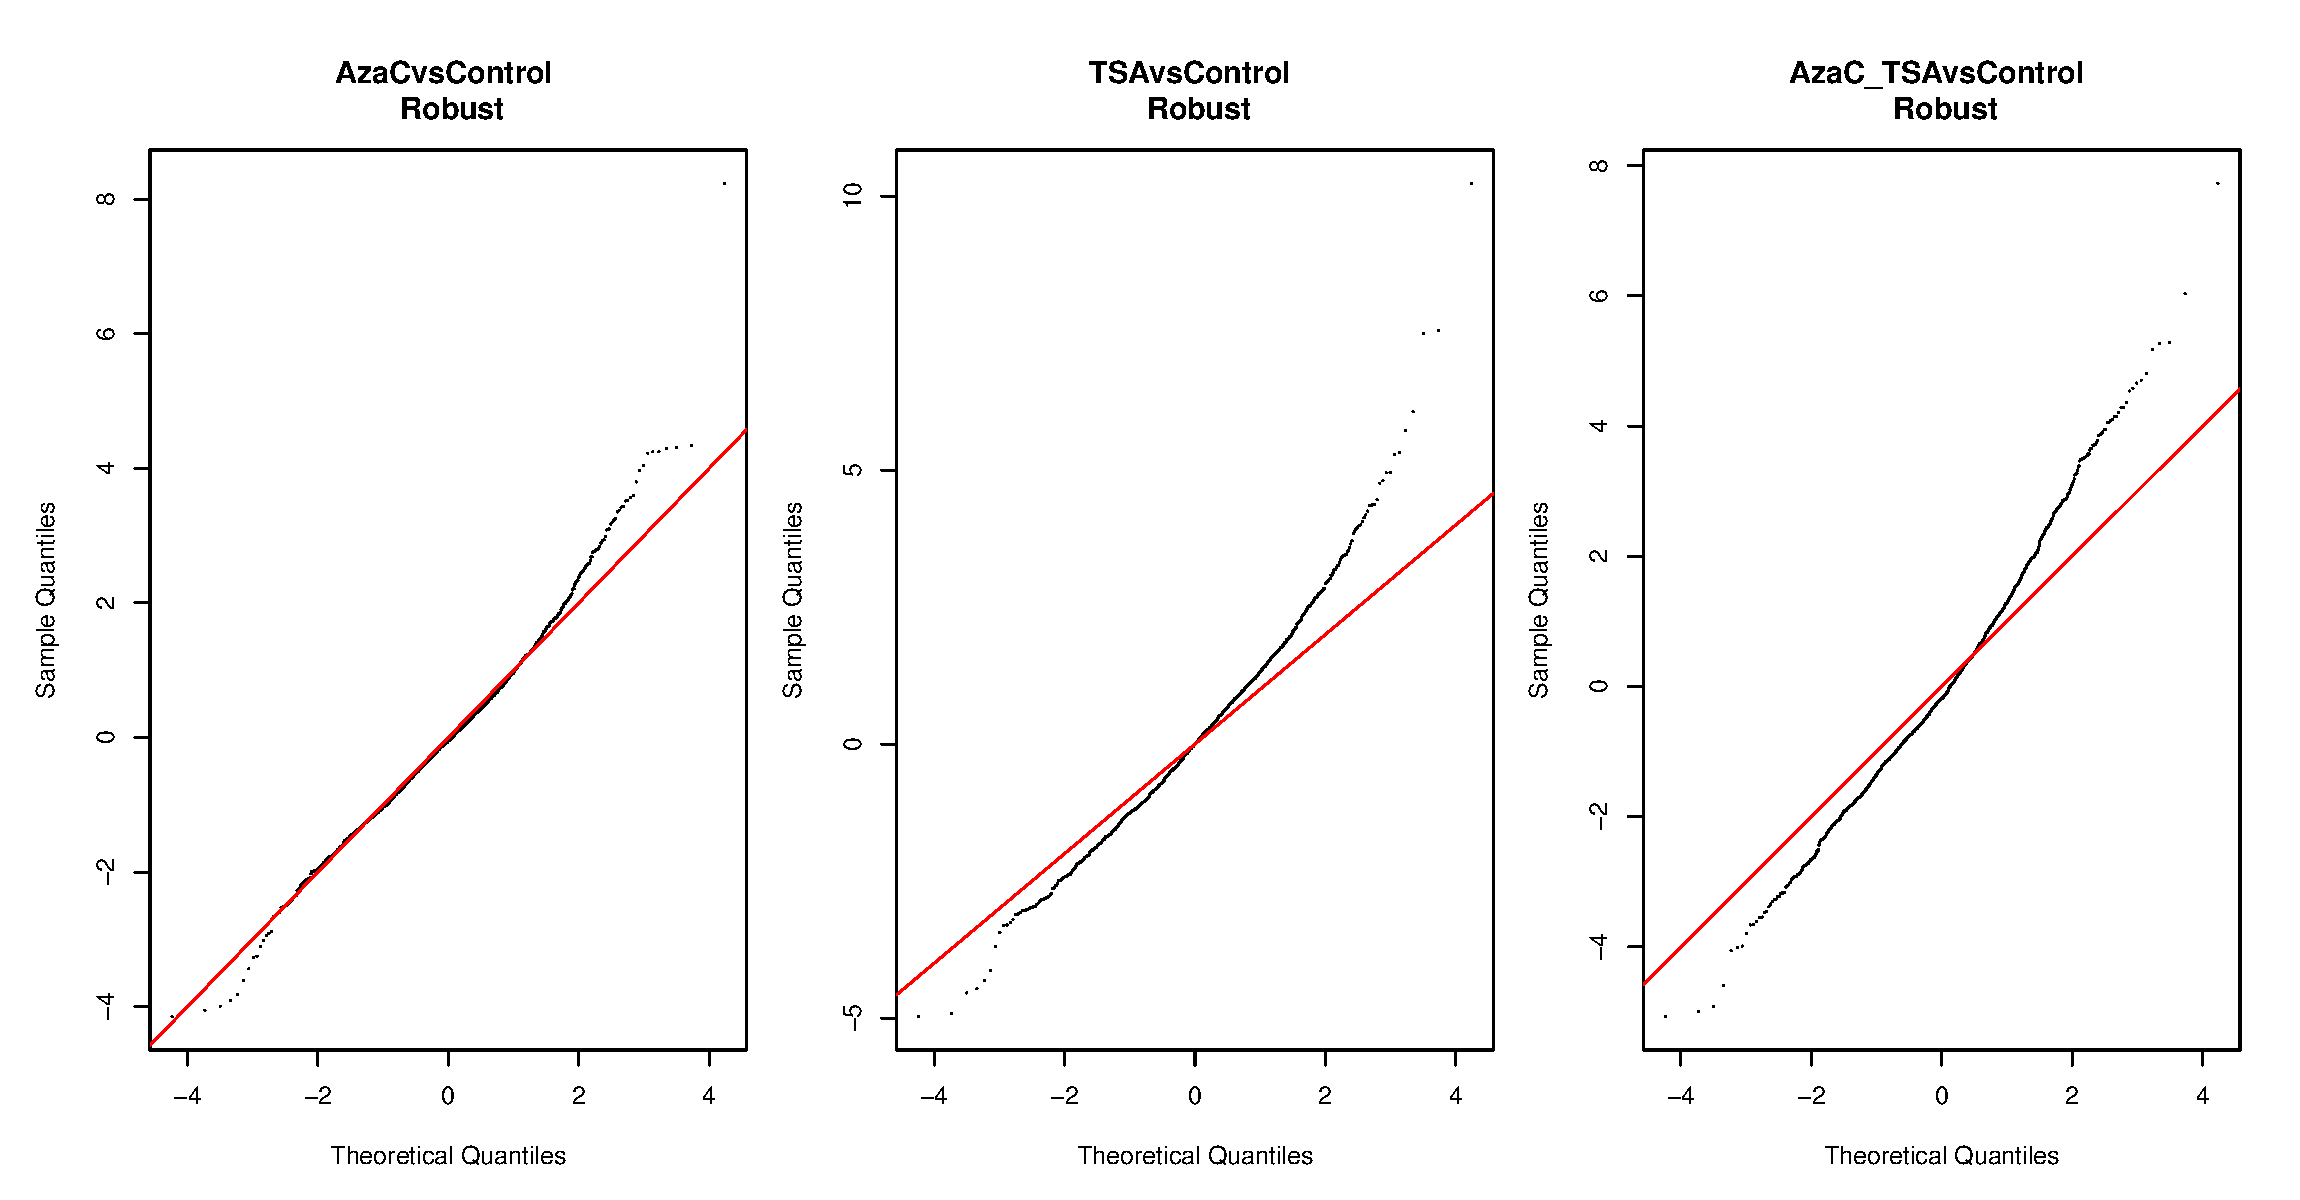
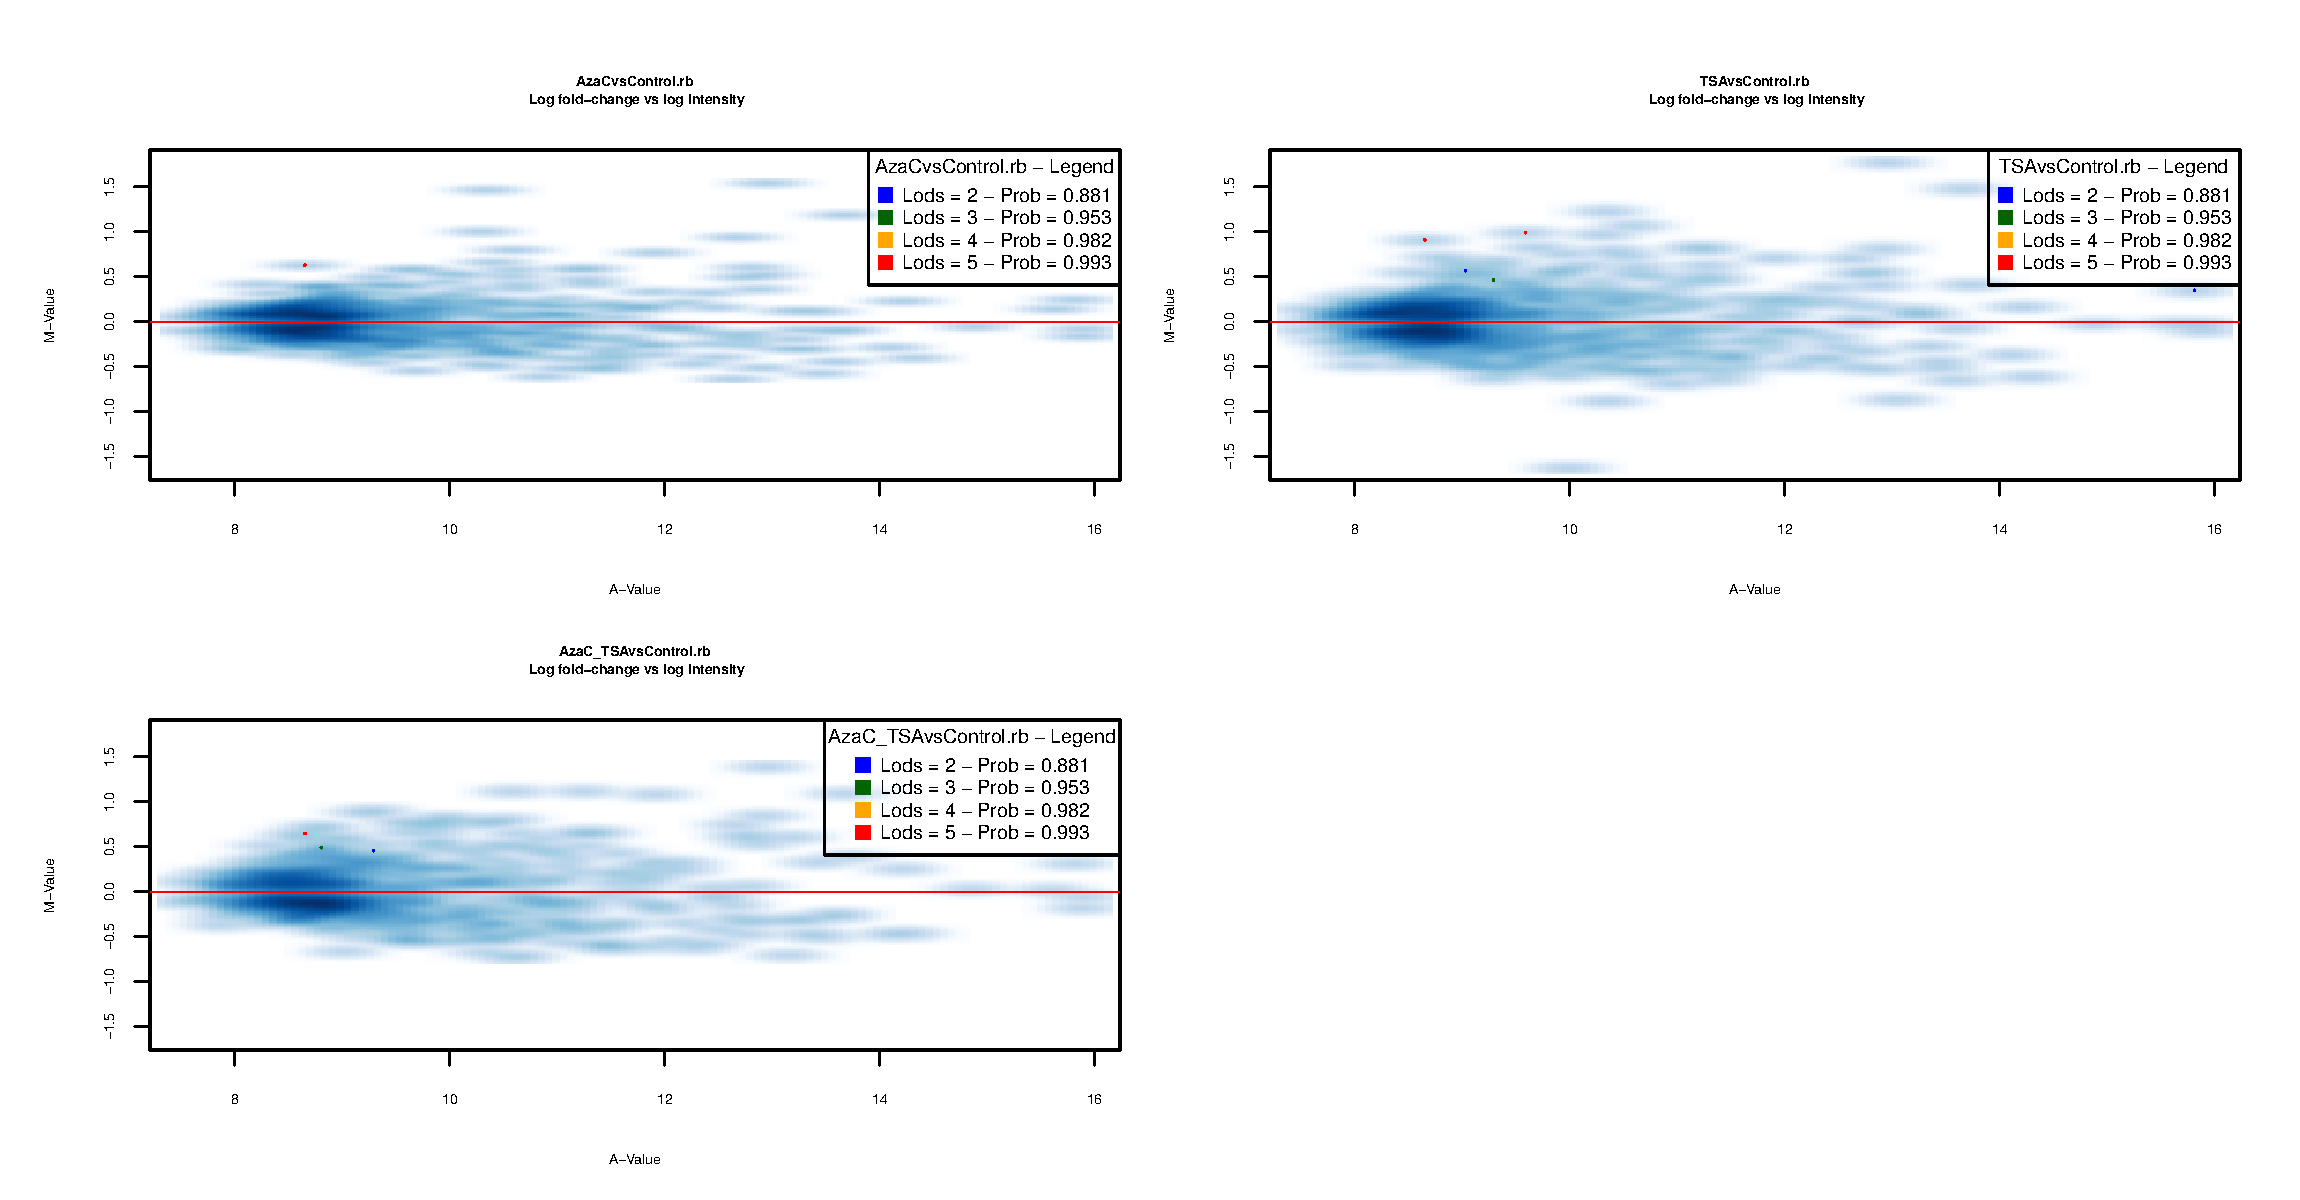
| AzaC_TSAvsControl.rb | ANOVA MODEL (all genes and samples, robust), AzaC_TSAvsControl contrast: AzaC + TSA vs. Control cell lines, genes with B-statistics > 90th percentile |
| AzaCvsControl.ls | ANOVA MODEL (all genes and samples, least squares), AzaCvsControl contrast: AzaC vs. Control cell lines, genes with B-statistics > 90th percentile |
| AzaCvsControl.rb | ANOVA MODEL (all genes and samples, robust), AzaCvsControl contrast: AzaC vs. Control cell lines, genes with B-statistics > 90th percentile |
| TSAvsControl.ls | ANOVA MODEL (all genes and samples, least squares), TSAvsControl contrast: TSA vs. Control cell lines, genes with B-statistics > 90th percentile |
| TSAvsControl.rb | ANOVA MODEL (all genes and samples, robust), TSAvsControl contrast: TSA vs. Control cell lines, genes with B-statistics > 90th percentile |